April on the Flat
For flat fans the long winter wait for the new turf season is almost at an end. For me it is the most exciting part of the year as the weather is starting to ‘turn’ and all the winter number crunching and research I have done will start to get ‘tested’ with real cash. From a personal perspective I have not been starved of flat racing over the winter as all weather racing has kept things ticking over nicely. However, there is nothing like the buzz of something ‘new’ and getting to experience watching racing at many different and unique UK tracks.
In this article I will be looking at the UK flat results (turf + all weather) going back to 2016, with the main focus being trainer performance in April. Due to Covid there was no racing in April 2020 so that needs to be noted.
Profits / losses will be calculated to Betfair Starting Price (BSP).
Normally when I write about trainers in April I look solely at their performance within that month. Exclusively using April data has its place, and I will share that, but I also want to compare that performance in April with that of May to October. I have never really delved into how April stats match up to other times of the year – well from an individual trainer’s perspective anyway.
April
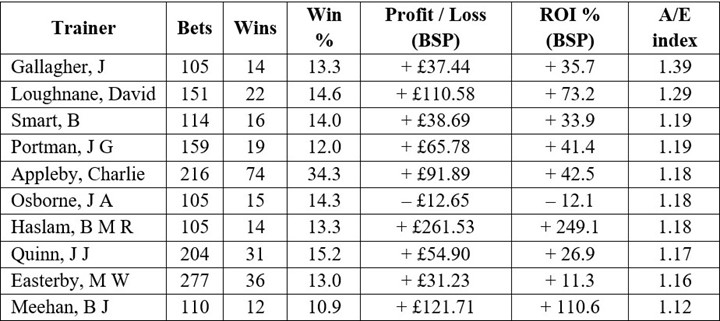
Starting with April let me share with you the trainers who have the highest strike rates in this month going back to 2016 – the ten highest are shown (100 runs minimum to qualify):
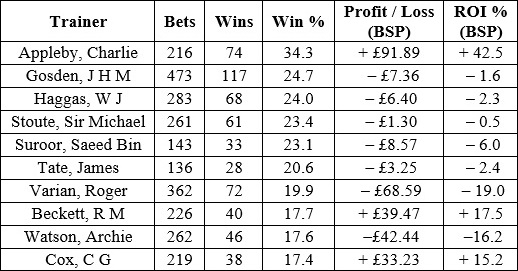
Some big guns there as one might expect. However, only three have secured a profit namely Appleby, Beckett, and Cox. Charlie Appleby’s figures look excellent so is worth a deeper dive into his performance.
Firstly, let me take a look at his win strike rate percentage by year:
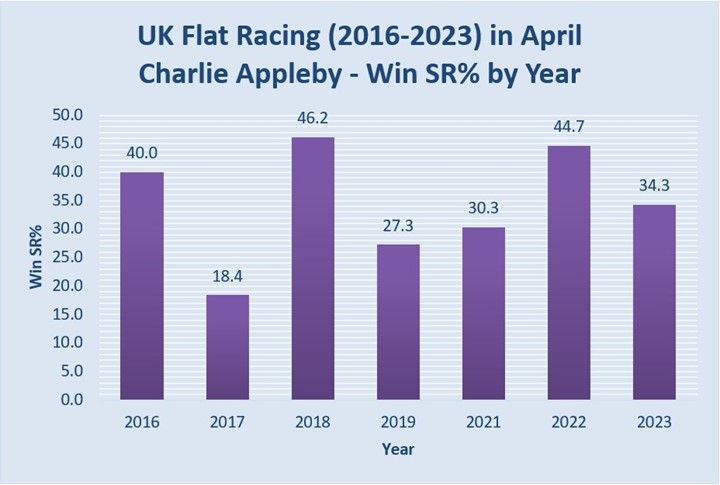
Five of the seven Aprils have seen strike rates more than 30% which is very impressive, with 3 hitting 40%+ (even more impressive). 2017 looks like a poor April but losses were extremely small at just over 2 pence in the £.
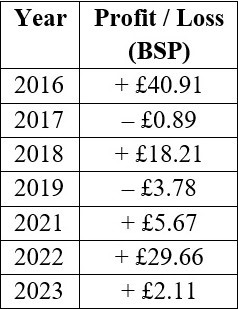
In terms of profits, Appleby has made a BSP profit in five of the seven as the table below shows:
What I find even more impressive is when we look at his record by using market factors, specifically Starting Price.
For this I have used Industry Starting Price to create the price bands (profits have still been calculated to BSP):
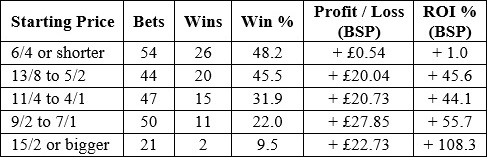
All five of the price bands have shown a profit with four of the five seeing returns more than 40%. In addition, there are no huge priced winners skewing his figures. His runners have just outrun their odds offering decent value to anyone who bet his runners.
If we look at his yearly A/E indices which is a good measure of value, we see the following:
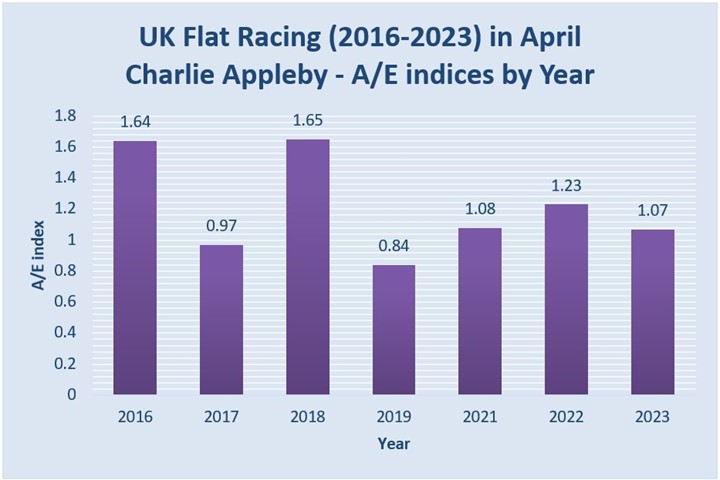
Five of the seven above the magic figure 1.00 – anything above this indicates these runners have been value. The 2016 and 2018 indices are huge!
Only 2019 shows a modest figure; 2017’s 0.97 mark is still higher than the average for all trainers in April which stands at 0.87.
Now I like A/E indices above anything else when examining horse racing stats so now let me share the trainers with the highest A/E indices in April.
Again, this is the top ten and 100 races is the minimum to qualify:
Appleby makes this list too which is no surprise given the figures seen in the previous graph.
Nine of the ten trainers have been profitable showing why A/E indices are important for punters to be aware of.
Also, some of these trainers could potentially slip under the radar of many of us so to be aware of their positive April record is useful to say the least.
This is a Gold member article, if you are a Gold or Platinum member you can read the whole article here or you can upgrade your account here.