Market Factors for Cheltenham
By the time you read this we will be within a couple of weeks of arguably the biggest racing festival of the year at Cheltenham. In this article I am going to look at an alternative way to look at market trends in some of the Cheltenham festival races.
I will be looking back to 1997 giving me 26 years of race data.
Normally with big race trends when you analyze past market factors you focus on the favourite, or specific price brackets. Here I am going to split the betting market data for each race into three thirds – essentially this is the same way that I use to investigate draw bias at individual course and distances.
The idea is a relatively straight-forward one.
Horses with the shortest prices will be placed in the top third of the market, more mid-range prices will be placed in the middle third of the market, while the bigger prices will be placed in the bottom third of the market.
One slight downfall of this method is that there is not always an even split due to the actual number of runners. However, I will use the same ‘tweak’ I do for my draw bias work meaning that it should balance out fairly as the table below shows:
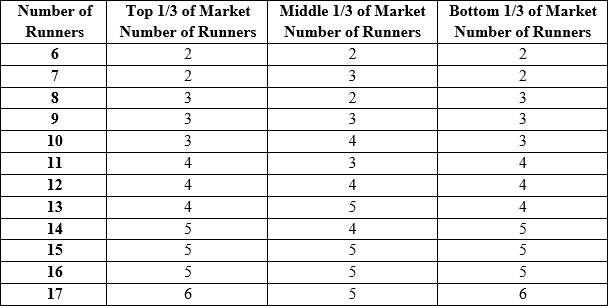
Hence, with 7, 10, 13 or 16 runners, the middle ‘third’ gets the extra runner, while races with 8, 11, 14 or 17 runners the top and bottom ‘thirds’ get the extra runner. Hopefully therefore, we will get a fairly accurate reflection of how the market behaves.
From 2008 onwards I have used Betfair Starting Price (BSP) rather than Industry Starting Price to do this as it makes the splits easier due to very few joint market positions. For the years 1997 to 2007 I have used Industry SP as BSP was not ‘a thing’ then. Each ‘third’ will produce a percentage win figure – in simplistic terms let us imagine a series of 100 races. If the top ‘third’ of the market won 65 of those races; the middle ‘third’ won 25 and the bottom ‘third’ won 10, then the market percentages would be 65% for the top, 25% for the middle and 10% for the bottom.
Gold Cup
– Let me start by looking at the biggest race of the week. This 3-mile 2-furlong chase takes place on the last day of the meeting and here are the market splits:

As we can see this race has been dominated by the front end (top third) of the betting market. Essentially 8 out of every 10 races have gone to that group.
Now of course you would expect this group to dominate, and hence it will be interesting to compare these figures with other races.
For the record 21 out of the last 23 Gold Cups (91.3%) have seen the winner come from the top third of the betting market. In terms of ‘places’ – of the 52 horses that have finished 2nd or 3rd, 23 came from the top third of the betting (44.2%), 20 came from the middle third (38.5%) and 9 came from the bottom third (17.3%).
Hence, the stats are clearly pointing towards the top third of the market for win bet purposes.
If you are a placepot player, then there may be some value in putting in a horse or two from the middle third of the market.
For our Gold and Platinum readers Dave looks at the market factors for The Champion Hurdle, The Vincent O’Brien handicap Hurdle, and The Arkle Chase.
To read the rest of this article you can upgrade your account here.
Already a Gold or Platinum member? Read the full article in Issue 112
This is a Gold member article, if you are a Gold or Platinum member you can read the whole article here or you can upgrade your account here.