

Past Market Prices and Creating An Odds Line
Virtually all punters look at the current price of a horse when determining whether to have a bet or not. However, do past prices help in any way? This article investigates past prices and what can be gleaned from them.
The data for this article has been taken from UK flat racing (including the all weather) from 1st January 2014 to 31st December 2021. In terms of prices, I have used Industry Starting Prices (not Betfair SP).
My initial plan for this article is to look at the starting prices of the last two runs to see if this gives us any useful information. From there, I am going to show you how to create your own odds line or betting book.
I am going to start by comparing the strike rate of horses in their next race depending on their last two starting prices from their previous two starts.
In order to do this, I have split the prices into the following nine price bands:
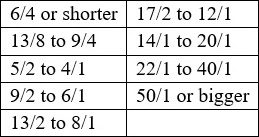
We need to use price bands to give us big enough data sets to work with.
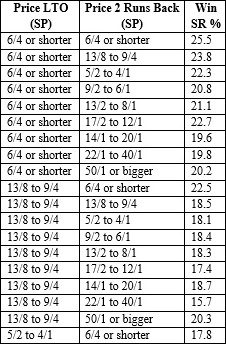
In the rather large table below we can see what affect the previous prices have had on performance.
Hence, the first row in table tells us that if a horse started at 6/4 or less on both of its last two starts, then its chance of winning next time has been 25.5%.
The second row tells us that if a horse started 6/4 or shorter last time out and was priced between 13/8 and 9/4 two starts back, then its chance of winning next time has been 23.8%.
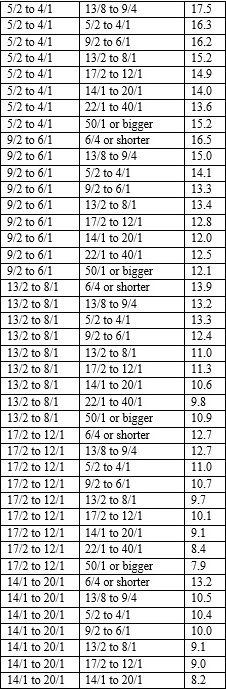
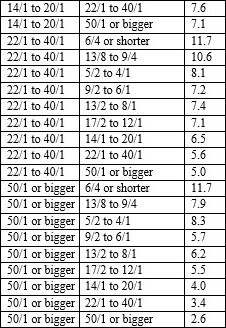
The final row shows that horses that started 50/1 or bigger on both of their last two starts have had a 2.6% chance of winning next time.
Masses of data there, but all useful. I will hopefully show you how useful a bit later!
What it does tell me is that the price last time out is more accurate in determining win percentage than the price two starts back (when looking at the two prices in isolation). This is of course what one would expect.
We would expect to see shorter prices LTO out- perform shorter prices 2 runs back; likewise bigger priced runners LTO should fare slightly less well than bigger priced runners 2 runs back. Here is the comparison taking the prices in isolation:
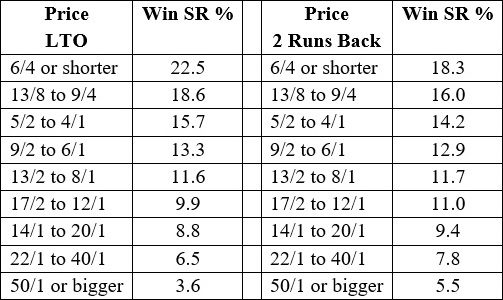
As we can see all horses that started 6/4 or shorter LTO won 22.5% next time; those priced 6/4 or shorter two runs back won 18.3% next time. A clear win percentage advantage to the LTO data, therefore.
This trend continues with the shorter priced runners LTO (up to 6/1 or shorter). Once we get to prices 17/2 or bigger than the percentages flip in favour of the price of horses two runs back as was expected.
Hence, LTO price is more important than price 2 starts back but combining both I think gives the most accuracy.
At this juncture you may be thinking what can I as a punter do with information? Here is one way of using the information that you could consider:
I am going to assume you wish to bet a horse whose price is 14/1. Firstly, take a look at the horses’ prices in their last two runs.
Let us for argument’s sake say the horse was 8/1 LTO and 25/1 the time before.
Knowing these two prices means we need to look for the relevant row in the table I shared with you at the beginning of this article. Here it is:
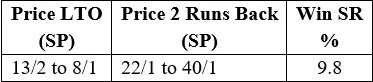
This suggests the horse has around a 10% chance of winning which equates to a price of 9/1. This is a relatively rudimentary way to compare the chances of a horse winning but ultimately 14/1 does not look a bad price based on the data we now have at our disposal.
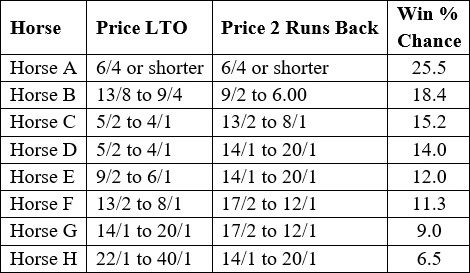
This simple idea could be expanded to creating your own odds line (betting book) for any specific race. Let me show you how you may try to tackle this. Let us imagine an 8 runner race with the following recent price data:
Using their implied win % chance we can convert these into basic odds.
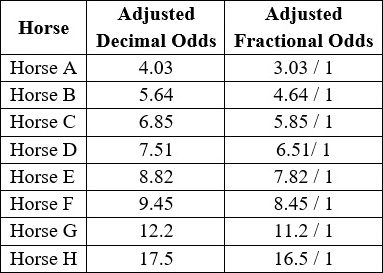
I am giving you both decimal odds and traditional fractional odds as I know some people prefer one over the other:
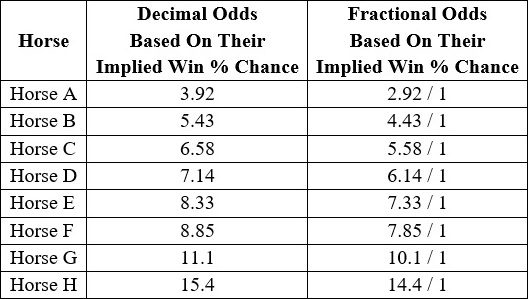
Now this ‘betting book’ equates to an over-round of nearly 12%.
This is calculated by adding up the win % chance values of the eight horses. When you add these totals up it equals 111.94% – a true betting market should add up to 100%. Hence I need to adjust the prices slightly as we would prefer the over-round figure to be around 5 to 7%.
This is the type of over-round need to achieve to be able to compare our odds with the best odds on offer (usually Betfair Exchange prices).
I need to lengthen the prices of the runners to achieve a more comparable over-round; ideally adjusting each runner by a similar proportion:
This now gives us an over-round of 6.3% which is perfectly workable.
We are now at the point where we can compare our prices with the Betfair Exchange to see if any of the horses have a much bigger price on Betfair. Any horse which does, potentially offers us a value bet.
Therefore, to create any type of odds line you need to be able to give each horse in the race a percentage chance of success; the more accurate you are at this, the better and more efficient your odds line will be. You can then, as you have seen in my example, turn those percentages into betting odds. They may well need tweaking a little, like I did, depending on the over-round.
Clearly I have used a fairly basic example by creating an odds line based on the percentage chance calculated from the last two starting prices of each of the horses. I am not advocating this as the best method you could use when creating your own odds line, but it is an idea showing how you might go about it.
David Renham
Featured Image: © Copyright Richard Humphrey and licensed for reuse under CC BY 4.0