A Revision of Compiling “Tissue Odds” from Ratings – Part I
The following article is designed to enable the reader to produce their own betting forecast or tissue prices.
Devised by Rory Delargy of Racing Consultants the method will hopefully help you to find your preferred your daily value bets.
The job of the odds compiler may be one surrounded in mathematics, but ultimately there will aways be a massive amount of speculation and opinion, and varying degrees of confidence based on the figures generated and used.
Rory’s method hopes to demonstrate how to price a race based on ratings, but it will become clear that the odds generated are only ever as accurate as the ratings from which they are made. Success comes from the process of refinement, and from your own personal refinement based on your own experiences.
In short, the method converts performance ratings (whether those performance ratings are supplied by a third party, i.e. The racing Post, Timeform etc, or from your own figures), to the approximate odds which fit those ratings.
The final tissue price is only ever as good as the initial information from which it is formed. If your ratings are inaccurate or “less than robust” then the prices they produce should be used with a degree of scepticism.
A horse’s rating (adjusted for the weight carried in the race) will imply its chances of success on the track when compared to the ratings of other runners in the same race, but the relationship between those numbers and the correct odds is not a simple one.
Adjustments need to be made based on the “degree of confidence” in the said rating and the suitability of the race as a betting opportunity.
Here’s an example:
A rating of 80 achieved by a once raced maiden cannot be seen as a reliable guide to the horse’s future performance when compared to a similar rating achieved on numerous occasions by an exposed handicapped horse.
The handicapped runner would give us a greater degree of confidence in our findings, while the maiden runner’s performance can be expected to vary considerably.
A spreadsheet created by Rory allows for a “generic” adjustment to be made to the level of confidence you have on the runner, while it will be necessary for manual adjustments to be made to the individual ratings to build an expectation of the improvement in unexposed runners.
Even after this there may be a need to tweak the final figures produced to allow for an element of common sense to take control, although this is a controversial element of the process.
There are a number of methods which can be used to convert simple ratings in to the odds, and the following one originally put forward by Simon Rowlands of Timeform can be used very effectively in an excel spreadsheet.
The recommended values used to deal with the reliability of different types of races, and also for ratings of dubious provenance can be adjusted according to the user’s preference.
The greater they are refined, the greater the spread of odds will be, which can identify value in the market, but with the caveat that doing so with notional ratings can lead to a false confidence.

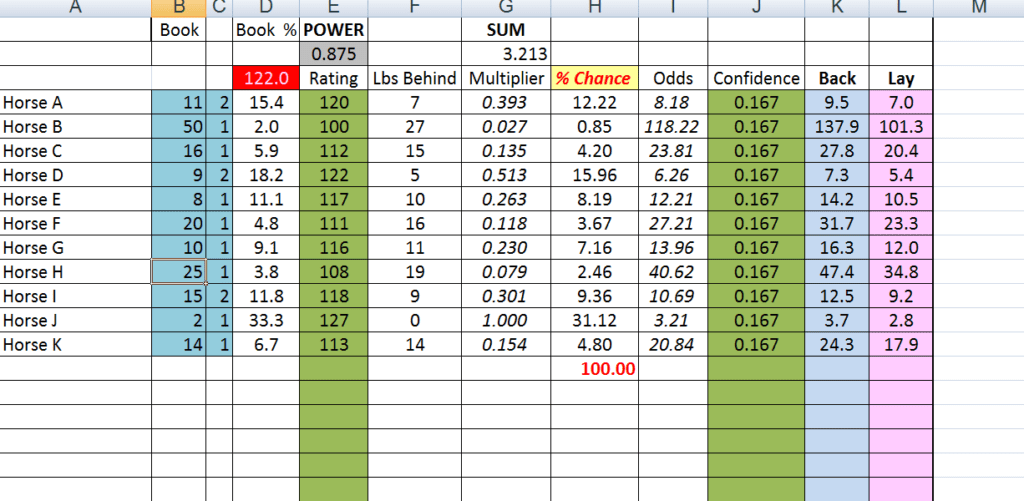
“The screenshot above shows the concept in action in a mythical 11-runner race, and to reproduce it will require some manual input of your own as follows:
Insert individual ratings in E4:E14 (extend this range for bigger fields, and don’t forget to do so for the formulae in other cells).
Insert “power” value in Cell E2 – this is a value between 0.75 and 1, designed to vary according the reliability of race type, where the higher class of contests tend to be the most reliable.
The best default value is somewhere in the middle, with 0.875 suggested.
Cell F4: = (MAX($E$4:$E$14))-E4, then copy down
Cell G4: = (POWER($E$2, F4)), then copy down
Cell G2: SUM(G4:G14)
Cell H4: =(G4*100)/$G$2, then copy down
Cell I4: =100/H4
Insert “confidence” value based on the confidence you feel in the rating (0.167 a fair default – in this instance, the smaller the figure, the smaller the margin for error, as can be seen in the relative discrepancy in the “back” and “lay” prices produced).
Cell K4 (back price): =100/(H4/(1+J4)), then copy down
Cell L4 (lay price): =100/(H4*(1+J4)), then copy down
For my part, I tend not to use the last 3 columns as prescribed by Mr Rowlands, although they make perfect sense.
I prefer to continue the process in the way a traditional odds-compiler would, so take the decimal odds produced in column “I”, and convert them into fractional odds, which I then enter manually in columns “B” & “C” (B for numerator and C for denominator).”
Column “D” is then set aside to calculate the overall book %, and is constructed thus:
Cell D4: =IF(F4=$B$1,0,IF(ISERROR(100/((B4/C4)+1)),0,100/((B4/C4)+1))), then copy down.
Now that the blueprint is there, it will enable you to play with the figures in whatever way you want.” – Rory
In the above example the prices of the runners in the race have been based on the High Street bookmaker model using traditional prices and adding in a margin of 2% per runner on average. When doing the same for Betfair prices it is necessary to price the race to around 102% in total. This will allow you to keep within that framework.
Once you are used to the spreadsheet you will very quickly see its advantages. It converts an abstract concept such as a list of numerical ratings in to a set of odds as offered by the bookmakers. This will then make the comparison of prices easy, but it will also become clear that the sheet has its limitations when used rigidly within a purely mathematical framework.
The method works very well for top class races for older horses where ability is clearly established, but it is of limited used in maiden races where many of the runners will have little or no rateable form.
How well the above method will work lies in the strength of the ratings. The drawback of all ratings is that they are a one dimensional assessment of a very complex idea, that being, the current ability of a racehorse.
The majority of ratings are based on historic performance and will tend to be a representation of the individual’s best most recent form.
If we look at horses A and B, both horses are rated 100, but where A’s historical ratings read 100/97/92/88/85 and B’s ratings are 99/100/100/99/100, both will be assigned the same rating, but it’s clear that one is regressing, while the other can be relied on to run to its rating.
No half competent odds-compiler would price these horses in the same bracket, but that’s what happens if a standout rating is used in the process.
What you are trying to achieve is a figure which predicts future form, and therefore it becomes important to put a figure on what rating a horse is likely to achieve under today’s conditions, bearing in mind the general pattern of its form (is it improving, regressing, or on a plateau of form?), the suitability of today’s conditions (is the race distance ideal, or too short/long? Is the going ideal, or too firm/soft?).
In answering these questions, we need to make qualitative decisions – to what degree is the individual runner compromised by conditions, and how much should we adjust our rating accordingly?
Finding a reliable means of adjusting ratings for current form and conditions (not to mention variables such as trainer form and the effect of the draw) is key in terms of producing accurate tissues and the next section will hopefully go a long way to helping with that task: –
Adjusting Ratings for More Efficient Tissues
As seen in the previous section we have looked at how we can produce a tissue derived from performance ratings, with the ability to adjust parameters according to confidence in the reliability of the ratings.
If we do this it will enable us to produce a semi-automated process to produce and tweak prices, but if we adjusted our degree of confidence this will only enable us to make adjustments to the tissue as a whole.
If you price races up on a regular basis you will know that the bare figures can on occasions throw up some anomalies which will require adjustments to individual runners, and to do this you need to have a much more robust process of rating the horses.
Sadly, though there is no “correct method” of adjusting the ratings which can guarantee us profit, and every individual bettor will need to find his/her own interpretation in order to produce an edge over the general market.
In general, conventional wisdom leads us all down the same path, and while often sage advice, it doesn’t tend to deviate from methods used by those who make the market, be they odds compliers in the traditional sense or exchange bettors.
The priority is not to deviate from said wisdom in a random fashion such as swimming against the crowd, but to use it, in the first instance before building on it to create that edge.
That will undoubtedly sound like hard work to many, and it is. Continually reproducing the process and refining it will make you a much better judge of the betting market.
“The rest is then up to you”.
What’s wrong with traditional performance ratings?
How do we breakthrough in tissue compilation this is a question we need to answer.
Performance ratings offer a one dimensional view of what a horse has achieved in the past, and makes no reference to the frequency with which a similar rating has been achieved, the conditions under which the ratings were achieved and generally little or no reference to whether that rating is backed up by either the stopwatch or the future form.
It is clear that we need to produce a rating which doesn’t simply give a reflection on the past, but one which, in some way, will also help us to predict the future.
If you are a regular watcher of Racing UK you will have probably heard James Willoughby going on about “Retrodictive Ratings”, by that he means the information we typically get from the official handicapper.
The official handicap ratings are a measure of what has been achieved, and are “worse than useless” for producing meaningful tissue prices.
Ratings produced by those like Timeform are much better as these tend to build in an adjustment for future improvement inherent in performances, but even these are of limited use. They are rigidly based on a master figure which is adjusted for nothing more than the weight carried.
In Part II next month we will look at how we can improve on the ratings created and the significant factors which hopefully can make them more effective when used to generate a line of odds.
Related reading
How to profit from backing 2nd favourites
Featured Image: Gambling Odds by Nick Youngson CC BY-SA 3.0 Alpha Stock Images


