National Hunt Trainers Facts and Figures
So, the nights continue to draw in; the winter is approaching, and therefore the National Hunt season is well underway.
In this article I am going to share some National Hunt trainer stats that hopefully will be of use to you over the coming weeks and months. I will be sharing UK National Hunt data going back to 2016. It is a table dominant piece, but there are around 1000 stats, which now will be at your fingertips.
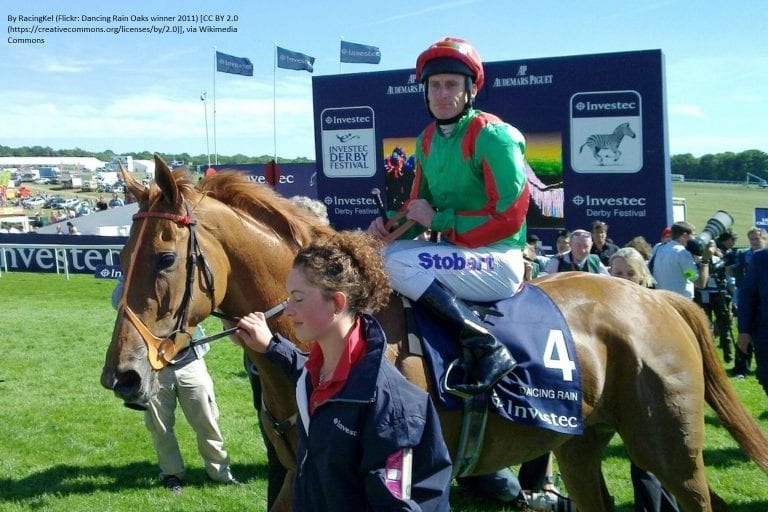
Monthly breakdown – to begin with let me look at 50 of the top trainers and compare their performance in November, December, and January.
I am sharing win strike rates and A/E indices. A/E indices are an indication of value. Any A/E index of 0.95 or above I would regard as positive, (1.00 or more indicates the runners have been ‘value’).
I have colour coded the A/E indices with green being positive (0.95 or higher), while red is negative (0.74 or below):
It is interesting to see only two trainers with three ‘greens’ for A/E indices. These are perhaps two of the slightly lesser lights in Jane Williams and Sandy Thompson, but I would keep an eye on them in the next two or three months.
Trainers tend to follow similar paths year in year out, so I would take a note of trainers with ‘greens’ and be very wary of trainers with ‘reds’.
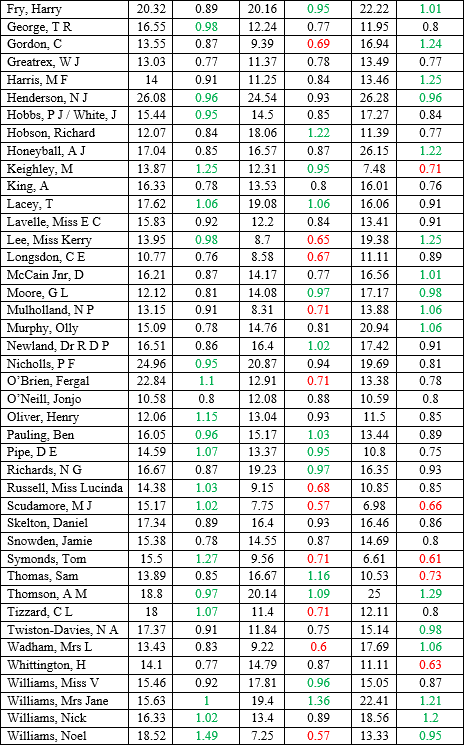
Race type breakdown – now a look at chase, hurdle, and NH Flat performance. To qualify trainers needed to have a good number of runners in each race type. A slightly smaller table here, but the same colour coding as before:
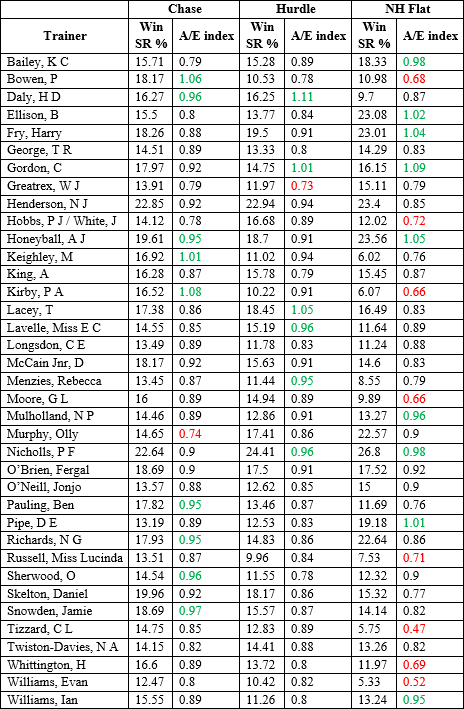
No trainer has managed three ‘greens’ here, which considering the large sample size for each one is no real surprise. However, four trainers have managed to secure A/E indices of 0.90 or higher across all three race types – Gordon, Honeyball, Nicholls and O’Brien. These are clearly very consistent trainers with all types of runners.
For me, the most interesting findings from the table are:
1. Peter Bowen has a considerably better record in chases as compared to hurdles and NH flat races.
2. Philip Kirby, Lucinda Russell, Colin Tizzard and Evan Williams have particularly poor records in NH Flat races. Poor strike rates combined with low A/E indices.
3. Henry Daly performs much better in chase and hurdle races compared to NH Flat races.
4. Brian Ellison, Harry Fry and Anthony Honeyball have strike rates in excess of 20% in NH Flat races, combined with A/E indices of over 1.00.
Personally, I use the data from this table when comparing trainers in a race. It is just a quick ready reckoner as it were to give some core stats when assessing certain races. I would use other tables like this as well, including the type of monthly breakdown table shown earlier.
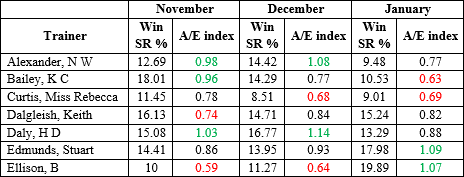
Price breakdown – to finish with here is breakdown of performance by price (SP). There are 55 trainers in this list and again I have colour coded as before:
David Renham
To read the rest of this article upgrade your account here.
Already a Gold or Platinum member? Read the full article in Issue 108
Featured Image: www.canva.com