
Poor Value Favourites on the Sand
I wonder how many readers of this article back favourites on a regular basis? It would be interesting to know.
My feeling is that the percentage of punters that regularly back favourites is less than before the turn of the century. My reasoning behind this theory is that the key word ‘value’ is more prominent in the minds of punters these days. Hence, as a rule, punters look for slightly bigger priced runners than favourites to try and find that illusive value.
However, the bottom line is that any price can represent value – as long as the price on offer is greater than the price it should be.
For example, if the true chance of a win is 50/50 and you can bet at 6/4 then you have value; likewise, if the true chance of a win is 12/1 and you can bet at 20/1, again you have value.
Just as there can be value betting opportunities, there are also bets that represent poor value. In this piece I will be focusing on favourites racing on the all weather. My aim is to try and highlight market leaders where the stats are indicating that they have been poor value.
The data has been taken from UK All Weather racing from 2017 to 2022 and I will be sharing the results for clear favourites only (not races where they are joint or co favs). Profits / losses have been calculated to Betfair Starting Price less 5% commission.
So, is the main point in finding poor value favourites to lay them on the exchanges?
This is not a strategy that ‘floats my boat’, although I am sure for some punters this could be an option. I have never had that much success laying horses and it is something I stopped doing years ago. I prefer finding poor value favourites and looking in depth at other runners in the race, as if the favourite is poor value, then there will be value to be found elsewhere.
It is time to crack on, I’ll start by looking at the performance of all clear favourites during this six-year time frame:
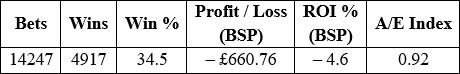
The strike rate edges just above one win every three, with losses coming to just over 4.5 pence in the £. So, there is no surprise to see that you would have lost money if you had backed all these favourites blind. However, losses are not that bad in the grand scheme of things.
The main reason for sharing these overall favourite stats was so that we have baseline figures to work from. It is important to realise that results for favourites do not fluctuate massively year on year. This can be seen if we look at the yearly breakdown of this period:
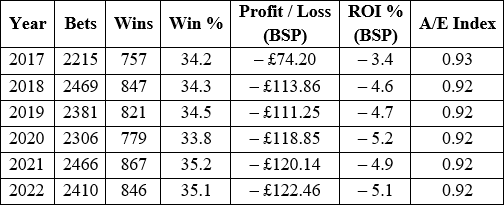
As the table shows, the strike rates all hover around the overall mark of 34.5%; likewise, the yearly returns have been similar, and the A/E index has stood at 0.92 for all bar 2017.
Course variances – I want to look at the individual all weather tracks to see what differences there are, if any. Here are my findings:
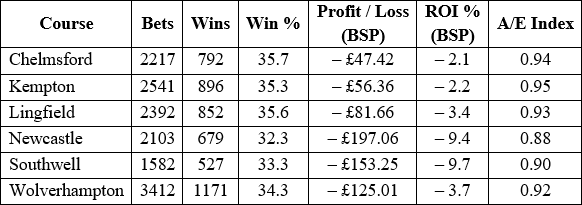
Four of the courses Chelmsford, Lingfield, Kempton and Wolves have very similar figures. However, Newcastle and Southwell’s figures are relatively poor in comparison. The Southwell stats may have something to do with the switch of surface from fibre sand to tapeta a couple of years ago. Hence, I would be a little wary of reading too much into them.
Looking at Newcastle, why are their favourite stats disappointing?
It is difficult to say. All individual years from 2019 to 2022 saw losses for favourites of more than 10p in the £, with 2022 being the worst seeing losses of 13p in the £.
Am I confident that Newcastle favourites will continue to struggle?
I have to say I am not sure, but 2023 (up to the end of October when I penned this) has also shown significant losses too – standing at 14p in the £.
To read the rest of this article you can upgrade your account here.
Already a Gold or Platinum member? Read the full article in Issue 110