R is for Racing
What do punters, bookies, professors, and programmers increasingly have in common? Data
R is for Racing is a longstanding book project dedicated to analysing British horse racing using R, the powerful and accessible statistical programming language.
I started working on it with Professor Jay Emerson of Yale University a number of years ago, with the objective of making the benefits of programming with horseracing data accessible to beginners and experienced users alike.
It’s an ambitious project since we plan to produce several volumes that will cover all key areas of horseracing analysis and the statistical techniques that can be used to tackle them for fun and profit.
About the Book
This first volume is now finished: R is for Racing: An Introduction. In it, the horseracing analysis focus is on the relationship between winning times, distance, going and class, as well as lots of introductory material about the domain.
From a programming perspective we cover data import, manipulation, cleaning, exploratory data analysis (EDA) and Bayesian modelling coupled with practical horseracing insight.
The first book is a 6 chapter introduction just over 100 pages long that combines code, visualisation, and explanation—all designed for newcomers and enthusiasts alike.
It covers everything from raw data inspection to Bayesian approaches for evaluating track conditions.
Is it about racing? Yes.
Is it about statistics? Yes.
Is it about R? Yes.
But don’t worry, it assumes no prior knowledge of racing, R, or data science. If you’re open-minded and willing to play with data, you’ll learn plenty.
And yes, after reading it, you’ll be able to generate your own plots, like this!
The Data: Free extracts from Smartform
The book is built around curated extracts from the Smartform database—a comprehensive, structured resource covering almost 25 years of UK and Irish horseracing, updated daily. For the purposes of the book, however, there is no dependency of having a Smartform subscription (though we hope you’ll want to after reading it!), since we’ve created:
Ready-to-use CSV extracts provided with the book, ready to use with R and run against all the coding examples we provide
- Includes historical race details, going, winning times, course, class, and more
Existing Smartform subscribers also receive a reusable R script to extract and analyse any subset of the data they want—perfect for custom modelling or focused exploration.
Teaching by Example: Let’s Look at a Plot
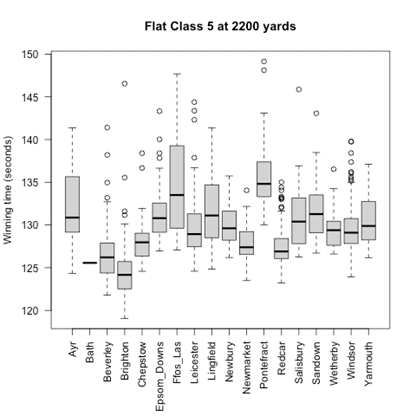
Here’s an example output from Chapter 2 of the book, which explores how track conditions (the going) affect winning times in Class 5 Flat races over 12 furlongs:
# Boxplot of winning times by going for Class 5 Flat Races
boxplot(winning_time_secs ~ going.f,
data = y,
subset = y$race_type == “Flat” & (y$class == 5),
las = 2, cex.axis = 0.85,
xlab = “”, ylab = “Winning time (seconds)”,
main = “Flat Class 5 at 2640 yards”)
Don’t worry if this doesn’t make sense yet, that’s what the book is for!
This simple plot allows readers to visualise the variation in performance across different goings. The lesson? Conditions matter. And not just for the horses—for the market too.
Imagine this: the Clerk of the Course declares the going as “Good to Soft”, but the first race runs unusually fast. Is it possible the surface is actually firmer than stated? If so, market inefficiencies can be exploited by alert, data-savvy punters who know how to interpret this discrepancy.
This is the kind of insight that R is for Racing: An Introduction is built to surface.
What Can You Learn (and Do) With It?
From the very first chapter, readers are encouraged to explore:
- How going affects performance
- How to clean and visualise racing data
- How to spot anomalies (like a possibly mis-declared track condition)
- How to think probabilistically—especially with Bayesian modelling (Chapter 5)
- How to build and adapt their own models
Each chapter comes with R code you can copy, run, and modify. The authors encourage mistakes, curiosity, and experimentation—because that’s how you learn.
Coming Soon: Even More Volumes
The R is for Racing project is designed to grow over time. Planned future topics include:
- Building your own handicapping model
- Automated betting using R
- Analysis of National Hunt and overseas racing
- R + ChatGPT vibe coding – for exploratory, conversational model building
How to Get Involved
The first chapters are being released incrementally via Patreon. Free members get the introductory chapters immediately, and full supporters gain access to the full data set to work with the code, the core book chapters released incrementally over the next 2 months, ongoing content, discussions, support and bonus code examples.
- Book Website: r4racing.net
- Patreon: patreon.com/r4racing
Join the community, run the code, and start thinking differently about horse racing.
Colin Magee