Runners Up in Handicaps LTO
I have written a few articles in the past on last time out winners, so I thought it would be interesting to look at last time out runners up. The focus for this piece is flat races, both turf and the all weather, with an added stipulation that the race must be a handicap, and the last race was also a handicap.
I am looking at 6 years of data from 1st January 2017 to 31st December 2022 and profits / losses have been calculated to Betfair Starting Price less 5% commission.
First things first let me look at the full set of results for horses that finished 2nd LTO in a flat handicap, and are tackling a handicap in this, their next race:
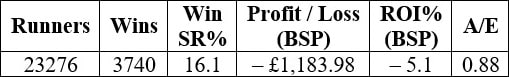
A thoroughly satisfactory strike rate hitting one win in every six runs, with losses to BSP of around 5p for every £1 staked.
These figures are actually very similar to LTO handicap winners – they score 18% of the time losing about ½ pence more in the £ (ROI –5.5%).
From this initial starting point, let me breakdown the data by individual year:
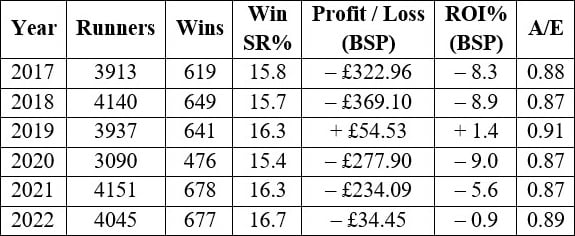
Yearly strike rates are similar year on year with a difference of just 1.3% between the ‘best’ and the ‘worst’ years. Returns are slightly more up and down as you would expect, with the one winning year in 2019.
Next, I wanted to see if there was any difference when we looked at the surface of the two runs as there are four possible combinations:
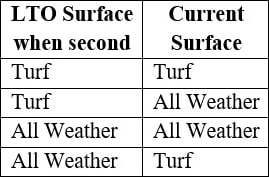
I wanted to check this out, because some horses do seem to perform better on either turf or the all weather, whereas for others it seems to make little or no difference. Here are the findings:
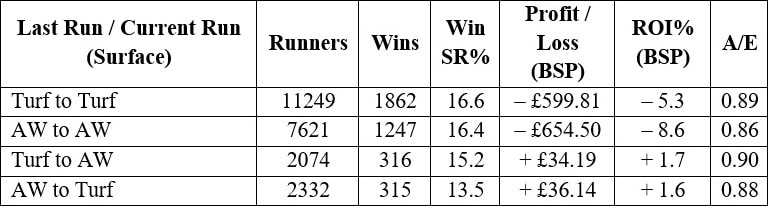
These figures are quite interesting. As you can see, when the surface has stayed the same (e.g., turf to turf, or AW to AW) the strike rates are higher than if there has been a change from one surface to the other. Having said that, the value has been with horses that have switched from one surface to the other. Despite the lower strike rates, both have edged into very small profits. I assume this is down to punter / bookmaker bias due to the different surface.
So, what about class? I wanted to compare the results of whether the horse ran in the same class or not.
Now horses that come second LTO will often race in the same class next time. Some will be upped in class, whereas a smaller proportion will be dropped in level. Here are the class change stats:
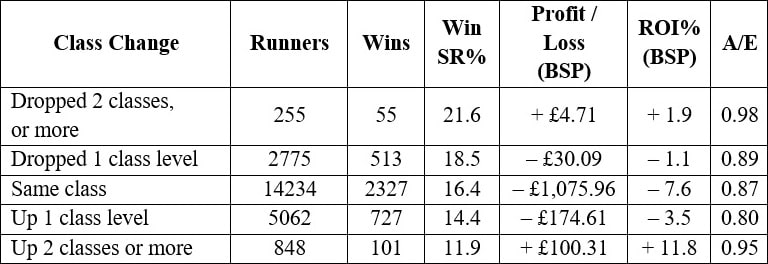
The strike rates correlate as you can see with it easier to win dropping in class, than it is being upped in class.
On the face of it horses upped two classes or more have done well from a profit perspective, but before getting too excited there has been a 146.4 BSP priced winner which skews the margin somewhat.
The good news from the class dropper data is that there have been no humongous priced winners and the biggest BSP winner has been 34.0. Indeed, the class dropping stats should encourage you to keep an eye out for any such horses dropping in class after finishing second in a handicap LTO, as backing all of them blind would have seen very minimal losses.
I would hope using a few other race reading factors to filter down these runners would potentially offer an avenue to small profits.
Sticking with these class droppers for a little longer, those horses that finished second in a class 2 handicap last time went onto to win 23% of the time if racing in class 3 or lower next time. They also secured profits to BSP of £95.44 (ROI +19.0%) with a highest BSP winner of 20.0.
On average you would expect to get 80 to 100 such runners each year, so I will be keeping an eye out for any of these horses in the future.
Back now to looking at all qualifiers – does the LTO course make any difference? It seems to when looking at one extreme to the other.
In the table below I have shared the top five courses in terms of strike rate, as well as the course with the five lowest strike rates:
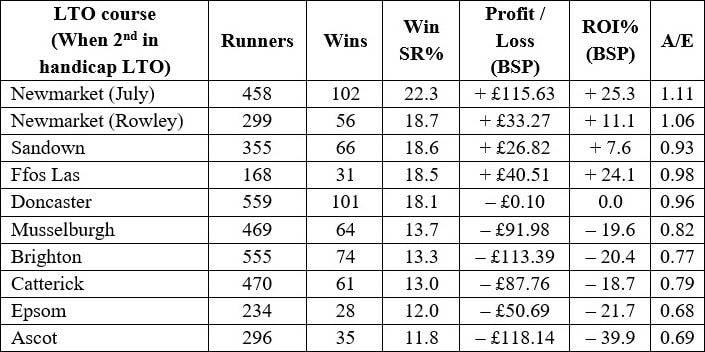
I have split Newmarket into their separate courses, and both have produced excellent results.
On the flip side I am not too surprised to see Brighton, Catterick and Epsom having poor results as all three tracks are quite unique.
I have always been sceptical about following form from Brighton, Catterick and Epsom when it comes to racing at a different track next time – and these stats help cement that long held view.
On to looking at handicap marks now – known as the horses’ Official Rating (OR for short).
As far as handicaps are concerned the official rating is used for calculating the amount of weight a horse carries. Hence, you may hear phrases like ‘this horse has been upped 2 pounds by the handicapper since its last run’.
This means his official rating has gone up by 2 points.
Horses that finished second in a handicap LTO tend to remain on the same handicap mark / OR, or the rating goes up. The handicapper is never that keen to drop the rating of a horse that finished second last time.
Let’s examine the stats:
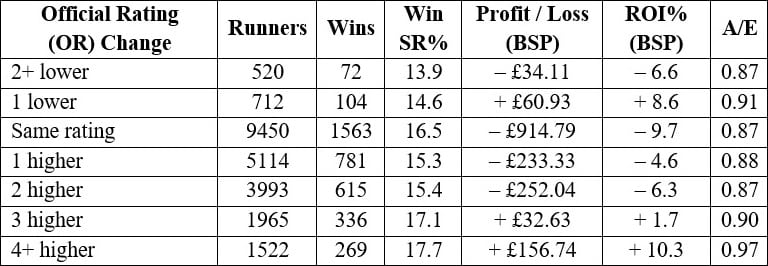
From this table it seems the horses that have been raised 3 pounds or more are definitely worth a second glance.
They have secured the best strike rate as well as producing positive returns.
The final area to look at is trainers – do some trainers excel with these runners up?
Below are all the trainers who have secured a strike rate of better than 1 win in 5:
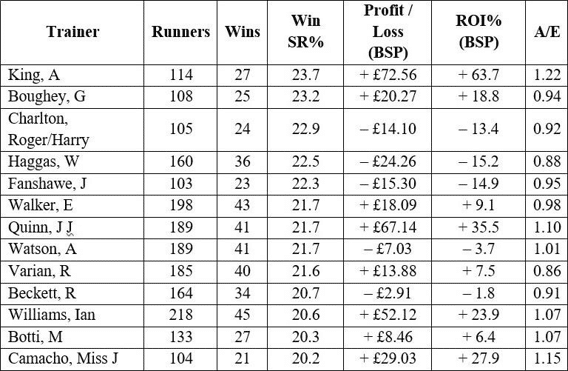
A good mix of trainers here – it is not just the select few as we sometimes see with trainer data. More than half have been profitable and generally it is the slightly less fashioned trainers that have achieved this.
Of course, for all the good records, there are poor ones too. Here are the trainers with the lowest strike rates:
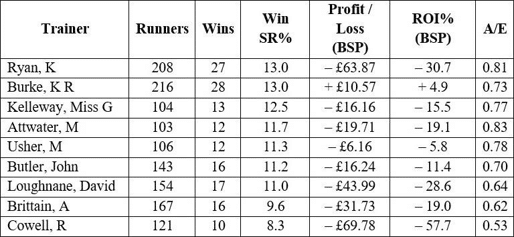
All bar one has made an overall loss, and I would be wary of backing LTO seconds from any of these stables.
So, there you have it – there are a few positives to look out for. The strongest two look to be.
- Horses upped 3 pounds or more (OR 3+)
- Horses dropped in class
I, for one, will be keeping an eye out for these in the future.
David Renham