
Analysing Jockeys When Riding Fancied Runners
As we head into May, I have decided to analyse some jockey data. I have looked at some of the top jockeys in the UK drilling into their records when riding so called ‘fancied’ runners. I have decided to use an SP of 3/1 or shorter as my definition of ‘fancied’ as far as this piece is concerned.
This article will be looking at the last seven full years (2019 to 2025), with the focus being UK flat racing (including the all-weather). All profits and losses have been calculated to Betfair Starting Price (BSP) less 2% commission on any winning bets. The excellent https://www.geegeez.co.uk/ site has provided the stats for this piece.
Before I get into the number crunching, it should be noted that for this article I will be adding a PRB column to my main tables. PRB stands for Percentage of Rivals Beaten. Percentage of Rivals Beaten is a calculation based on a horse's finishing position in relation to field size.
The formula is as follows:
PRB makes key distinctions between a horse finishing, say, fourth in a seven-runner horse race (PRB 50%, three rivals beaten, beaten by three rivals) and finishing fourth in a sixteen-runner horse race (PRB 80%, twelve rivals beaten, beaten by three rivals).
I will be expressing the PRB as a number between 0 and 1. So, in the examples above, 50% equates to 0.50 and 80% to 0.80.
As horse racing researchers, we can often be impaired by small sample sizes when analysing, for example, win strike rates or ROI%.
Hence, there is a strong argument to suggest that PRB figures are a more accurate metric, simply because they make the datasets bigger: they award a sliding performance score to every runner in every race, whereas win strike rate for example, only awards the winner a score with all other finishers getting zero.
Obviously win strike rate is important, but PRBs give us something extra that can potentially help us to make more sense of the stats.
For this piece, the PRBs are likely to be quite close to each other due to having a short price restriction in place coupled with decent sample sizes. However, it will be interesting to compare individual jockey PRBs.
ALL RACES - Let me start by looking at the results for all races so this includes both the turf and the AW, as well as handicaps and non-handicaps.
Losses have been highlighted in red.
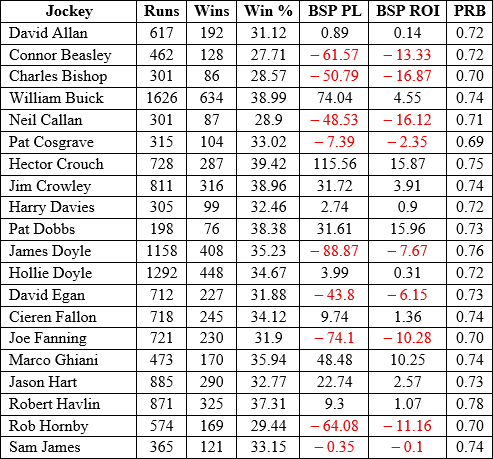
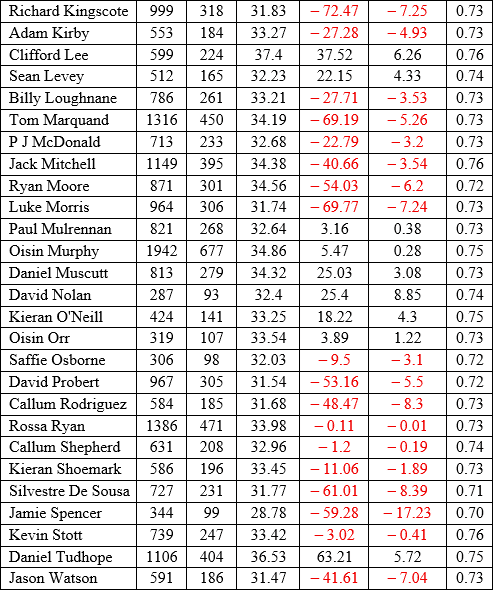
20 of the 47 jockeys have made a blind profit which is impressive given the tight price restraint in place, as well as decent sample sizes. The PRBs range from a high of 0.78 for Rob Havlin to a low of 0.69 for Pat Cosgrave.
The average figure across all these jockeys came out at 0.73.
In terms of profits / returns, Pat Dobbs and Hector Crouch have both done exceptionally well to secure ROI%s of 15%+, while Marco Ghiani should also be noted for his +10.25% figure.
On the flip side, there are three jockeys who have shown very poor returns with these 3/1 or shorter rides and they are Jamie Spencer, Charles Bishop and Neil Callan.
All three have seen ROI% losses of 16% +, which equates to losses of just over 16 pence for every £1 staked. It is quite surprising to see such differences between certain jockeys considering the price band we are looking at.
|
The rest of this article is for Platinum members. You've just seen what our experts do with publicly available data — the Platinum section is where the specific angles, numbers and actionable conclusions live. Platinum members also get daily system selections in their inbox by 2am, tips from top tipsters, Win Big Golf selections, and access to 11 years of magazine archives. |