Cheekpieces
This is something I’d been meaning to look into for a while. It’s something that I occasionally use as a filter, in fact it’s often a filter to remove losses rather than as a positive. This led me to think that there must be trainers that use it extensively, one’s that rarely use it and with both options there must be those who know when it will work and those who are perhaps just taking an educated guess that it will improve the horses concentration and consequently its performance.
So, is it the real deal or all the (head) gear and no idea?
Let’s start by taking an overall look at headgear. I wanted to get a full year of data so we’ll use 2024 to begin with. The following table is for all races across the UK and Ireland for all codes during 2024.

A shade fewer than 15% of runners wore cheekpieces. Basic strike rate is just under the ‘no headgear’ strike rate and that and visor are the two pieces of headgear that more or less match the strike rate of non headgear wearers.
Let’s break it down by code now.

Rather interesting that the National Hunt was 662.13 up for 2024. I would have to assume there are some big winners in there. It is also the best strike rate but that is more than likely down to the average field size I would imagine. A quick check confirms a winner on the 22nd August at a BSP of 168.99 helped but not quite as much as the 529.37 BSP on the 16th!!
As the principle idea behind cheekpieces is to improve the concentration of the horse then it stands to reason that a fair proportion of the horses will be in the second half of the market. I’m going to set a previous race ISP range of 10/1 to 50/1 now and see what things look like in terms of are we getting improvement.
That’s interesting. Strike rate is a fair bit lower but again we don’t know field sizes and horse odds are going to be generally larger. However they turned a profit, albeit a small one but the A/E was 1.07. Were there any big winners though?

There was one three figure winner. A 119.94 BSP in July which does leave an 80 point loss without it.
However, it’s not as if you’re going to return the money if you won it is it?
A look now at all those under an SP of 10/1

A tiny profit and an A/E of 1.06.
It would be remiss not to see what a selection of years have done.
ISP in previous race under 10/1

A very consistent strike rate across the last five years but a wildly differing profit or loss suggesting it is potluck what odds the horses will win at.
ISP in previous race of 10/1 to 50/1

Four out of five years in profit is quite a surprise to see! It would seem most years have managed to pick up a big winner. Bearing in mind this is solely any horse on the NH who was 10/1 to 50/1 LTO and wearing cheekpieces in this race to see four out of the last five years in profit and A/E’s over 1 on all bar the losing year and even that was 0.97 is quite something. Every year also had a place profit as well, with this year just holding onto one to date.
Let’s have a look at the stats if this race is their first time with cheekpieces now.

It’s actually a bit worse, although still just in profit over the five years. It would seem perhaps that first time with cheekpieces is not an immediate success, although this is such a broad stroke I’m not sure how much relevance we can take from this table.
Let’s dial down a bit now and separate into chase/hurdle/NH Flat.
We’ll go back to our 10/1 to 50/1 group.

All profitable, all with positive A/E’s and two out of three with place profit. Hurdle place profit in particular is very big! Let’s start with Hurdles and I’m going to break it down into UK/Ireland now because I have a feeling those big place prices are probably coming from Irish racing with their big fields.

And that is the case. I’m curious to see if that’s a couple of huge prices or not, so we’ll take a look by year for the Irish Hurdles.

While there are no doubt some hefty one’s in there it’s actually surprised me to see every year is profitable on place, which isn’t the case for the wins.
Let’s take a look at the Betfair Place SP. Are they few and far between and really high or is there a good amount of the nicely priced wins? The latter would be nice.

This is actually a very nice looking table. Everything 2.50 or less on Betfair Place SP (BPSP) is just about break even. Beyond that it is very consistently showing a nice profit bar the odd one here and there.
On top of that the three place winners at very high odds that could be considered way above expectations only account for 113.3 points of the 415 points of place profit across the five years and in fact if we take from a BPSP of 24.01 and above then the whole batch come to a profit of just 2.3 points!
So those outliers are not accounting for our profit.
Let’s delve a little deeper into these Irish Hurdles places.
First a quick check to make sure it’s relevant to cheekpieces and not just across the board.

Well, that‘s reassuring. Bar a small place profit on Visor, cheekpieces is far and away the profitable angle.
No headgear is massively minus!
A look at race type shows that straight up Hurdle races show a loss as do Claimer Hurdles, although there are only 166 races between them.
The bulk of the place profit is in Handicap Hurdles, although the profit levels for Maiden and Novice Hurdles is good as well for the number of races.

Let’s take a look at those Handicap Hurdles.
A look across the five years gives us our first losing year, albeit just the 8pts over 516 bets, so not exactly a disaster.

There’s a couple of potentially interesting angles if we look at Forecast Odds for the race.
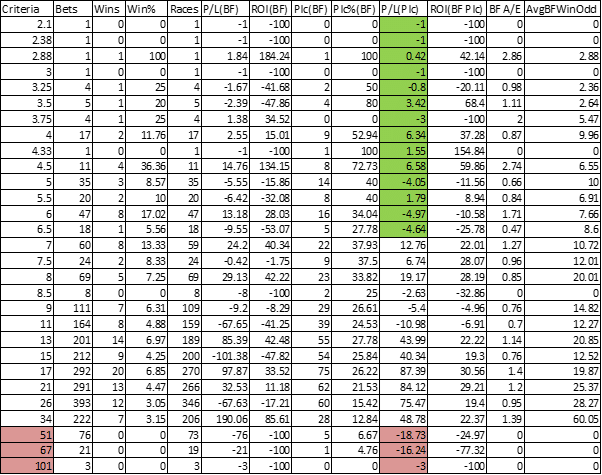
Firstly those with a forecast price of 51.00 (50/1) or higher draw an overall loss of almost 38 points across 100 bets. Secondly, those below 7.00 (6/1) total up for a loss of 0.36 points over 166 bets.
Next, we’ll take a look at the official rating move from their last race.
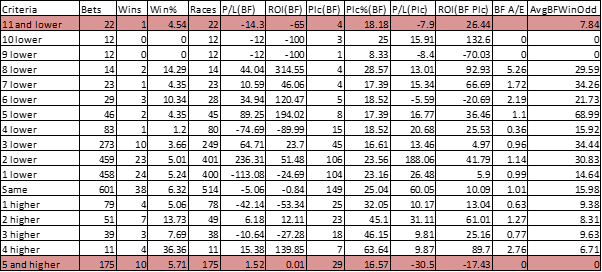
I’ve abridged the table to make it more concise as it was excessively long numbering each OR move. The long and short of it (if you’ll forgive the pun) is that everything from a drop of 10 to a raise of 4 is pretty much where all the place profit lies. There’s the odd profit here and there at lower and higher moves but they’re few and far between and surround by masses of losing bets as you can see from the highlighted lines where I’ve totalled them up all.
Below are the two ranges to better show the difference.

As you can see the place percentage is nearly 7% higher. If we’re thinking systems lets go back to our Forecast odds again and see if those odds ranges we identified still have any merit.
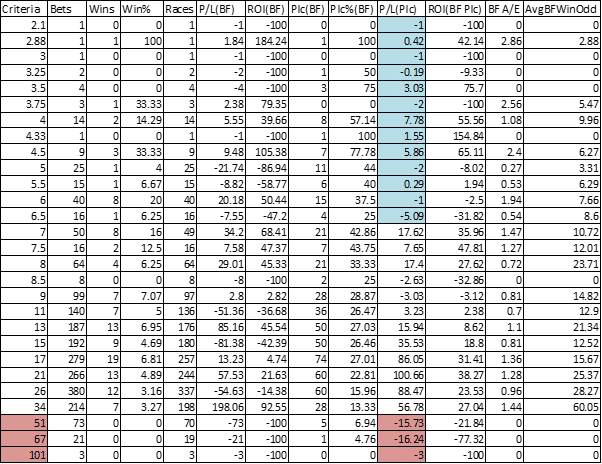
Yes, they are. The under 7.00 forecast is actually now showing a profit as well whilst those 51 and above are still showing losses with just 6 places from 97 bets. Let’s take that 7 to 34 range now then with our -10 to +4 OR movement as well.

All years in a place profit. The lowest is 14.44pts and this year which is 10.34 to date. Lots more to look at yet but just for reference during this five year period the longest losing run of places was 30, with the next longest 21, then 18. The longest winning run is 4 in a row which has happened 4 times.
Now we’ve cleared the wheat from the chaff let’s take a look at trainers and see if we can delve into one or two of them.
Below is a list of all the trainers who’ve all had at least 10 horses placed during these 5 years with the criteria that we’ve worked through so far.
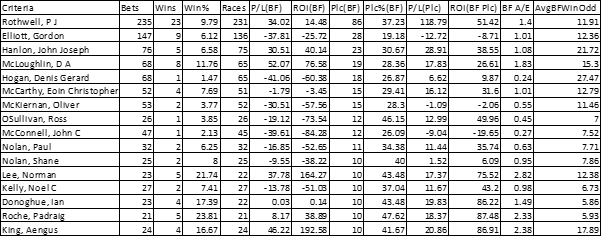
PJ Rothwell is someone who is certainly worth a further look at here. He’s placed 86 horses at a strike rate of 37.23. Let’s take a look at him and see how things fare over each of the years. Was the profit all in one year or is this a consistent thing with him?

The answer is yes the profit is consistent. Each of the five years shows a profit. That’s a possible system as it stands right there. Between now and the next cheekpieces article I will monitor Rothwell’s qualifiers and report back.
This cheekpieces dig will continue next month. Next time we’ll dive in a little deeper on Rothwell to see if there’s any extra filters that can be applied and take a look at all the trainers as a whole to see if there’s an overall system we can find for the hurdles. Then we’ll turn our attention away from the hurdles and on to the Chases and NH Flat races.
Matt Russell