Lose Less by John Cutts – Part VII
Our next instalment of Lose Less kindly provided by the author, John Cutts.
Reviews for the book have been very positive with an overall 4 star rating.
The most important thing…is picking a winner!
CHAPTER 9 – Strike Rate and Losing Runs
Bank size
I have ‘borrowed’ the quote below from a blog by Kieran at Make Your Betting Pay.
Kieran says:
“We need to strike the right balance between leveraging our profits and protecting the integrity of our bank.
My usual starting point when carrying out this kind of analysis would be to calculate the longest expected losing run over 1000 bets. There is a formula for calculating this (mail me if you’re interested) but I tend to use a table which makes life a lot easier. I’ve reproduced the table below (it’s accurate enough for our purposes).
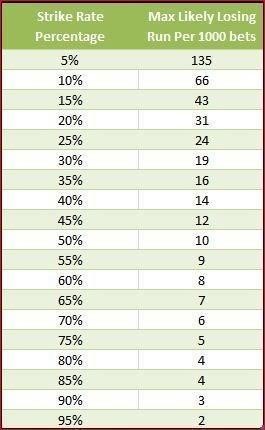
Figure 2 – Strike Rate Table (To calculate your longest losing run use our Longest Losing Run Calculator)
The important thing to remember here is that the larger the number of bets you look at, the longer the likely losing run will be. As an example, with a 15% strike rate looked at over 1000 bets you are likely to hit a maximum losing run of 43 bets. However, if you were to have 10,000 bets with a similar strike rate, at some point you are likely to hit a losing run of 57 bets. That being the case, it’s useful to have a reasonable idea of the number of bets your selection method is going to throw up over a period. If you are looking at a method that throws up 300 bets a year, then calculating your longest likely losing run over 1000 bets is ample. If you are looking at a method that throws up 10,000 bets a year, you need to dig a bit deeper than that.
Let’s assume the method we are analysing has 1000 bets a year with a strike rate of 60%. We can see from the table that we are likely to hit 8 consecutive losers at some point during year 1.
You can see that if we were to choose a 10% staking plan on such a method, we are almost certain to hit trouble and quite possibly decimate our bank at some point.
We therefore need our bank to be several times the size of our longest likely losing run – it is well within the realms of statistical possibility that we could get 2 such runs in quick succession!
For safety, I would say it is best to work with your bank broken down into a number of points that equates to 5 times your longest likely losing sequence.”
I heartily agree. There is no doubt that basing your staking on avoiding one long losing run is folly as it is more common that a series of losing runs is the bank breaker. Therefore, it is wise to allow for this.
Bet size
We tend to go for the higher strike rate/shorter odds selections. Why? Because the higher the strike rate, the more of our bank we can stake. We are also looking for winning clusters – multiples
Let’s say we have a one-thousand-pound bank and a strike rate of 20%.
According to the chart, you could expect a losing run of 31 over a thousand bets. But that’s not the whole picture. There will be many losing runs in the twenties and, as Kieran says, who’s to say you won’t hit (or beat!) the maximum soon after the first time!?
So, using Kieran’s advice, your bank would have to be 5 x 31 = 155 points. Using a £1K bank, the stake would be £1000 divided by 155 = £6.45 and you could expect typically long waits between wins.
Our short price/high strike rate philosophy means one of two things. Either you don’t need so big a starting bank, or you can bet a bigger proportion of a bigger bank.
To take the £1000 example. With a 50% strike rate we can expect a losing run of 10. Multiply by 5 and we have 50. Divide that into the bank of 1000 and our starting stake is £20.
Or, to take a different approach, we can back to £8 stakes from a bank of just £400, rather than a thousand. It is the same ratio.
We are a bit less conservative than Kieran. We use compounding and bet to stakes of 2.5% of the bank. After a winning day we up our stakes to 2.5% of the new, increased bank. After a losing day we reduce the stake to 2.5% of the reduced bank.
So, in a losing run, stakes automatically reduce. But in a winning run, they increase. This way we capitalise on winning runs but reduce losses on losing runs.
This also capitalises on the cluster phenomenon that our old friend Eric identified.
It is important, if compounding, to take money out from time to time, so as not to give the bookies the money back you have won from them.
You can grow your bank and spend some of it at the same time!
To recap: your singles stake is your expected longest losing run in a thousand bets multiplied by 5 (I would say 4 if you are compounding your stakes). Divide your bank by this longest losing run figure and you have your first stake.
Multiples staking
Add up your expected total returns from backing your horses in the bet multiple as singles.
Let’s take an example.
We have 4 selections, and they are all 2/1.
If we put a tenner on each and they all win, the return will be 30 pounds (return for a 2/1 winner) x 4 winners = 120 pounds returned and 80 pounds profit.
If we want to make the same profit backing the 4 in an acca, we simply put a 75p accumulator on.
Just back the amount that will give you the same profit as backing the 4 singles by working out the profit if backed as singles.
The formula for this is:
Divide your total returns if backed as singles – in this case 120 – by the total singles stakes of 40 = 3.
Now divide this figure by the number of selections (so 3 divided by 4 = 0.75) and you have your stake that will give you the same profit as though you had backed your multiples as singles.
To check, simply multiply 0.75 x the accumulated odds (3 x3 x 3 x 3 = 81) and you have as near as damn it, the same return as you would if you backed the same selections in tenner singles. But, because your stake was only 75 pence, you make an extra 19.75 profit!
Psychology
This a greatly underestimated factor in betting. Some thrive on risk others prefer the more softly softly “I don’t need the stress as I would like to live to spend the winnings” approach.
For even the most successful pro gamblers the odds and strike rate will not be too different. 50% winners at average odds of 6/5 would give a 120% Return on Investment (ROI) or 20% profit on stakes. Any pro would be delighted with that.
I know the average punter’s dream is a selection method that produces a 30% strike rate at average odds of 8/1. But this is unheard of.
Even if a more realistic 15% winners at 8/1 was possible, almost no-one would have the belief and discipline to see it through. With a 15% strike rate, the chart shows 43 as the longest losing run to expect. How many of us would get to even half those losers before giving up?
Having surveyed our subscribers, we know these losing runs are their biggest bugbear.