Decoding Trainer Intent with Smartform: A Deep Dive
When we created Smartform back in 2007, it was initially designed to complement the book Automatic Exchange Betting. At the time, there were no data sources available that allowed users to directly program with horse racing data. While many databases existed, they typically offered default views of the data configured by their creators, limiting users’ ability to build something truly unique. Smartform was conceived as a solution to this, providing a complex yet powerful system for individual bettors to analyse and create new variables, combining them programmatically in unique ways to develop custom visual tools, systems, and models.
In this article, we’ll dive into how Smartform can be used to decode trainer strategies, specifically focusing on how bettors can understand trainer intent from historical data patterns—without needing insider information. This is often considered a key aspect of successful betting and typically thought to be the preserve of those with close connections to the racing world. However, with the right tools and analysis, we can uncover these insights ourselves.
Starting with Trainer Capabilities
A good starting point is to appreciate a trainer’s overall capabilities. It’s unlikely that a trainer will campaign a horse to win a type of race where the trainer has been consistently unsuccessful in the past. The same logic applies to course preferences, race distances, speciality with a particular type of horse (e.g. by gender, or the progeny of certain sires and dams) and even jockey selections. By analysing these elements, we can gain initial insights into a trainer’s likely intent.
But we can go much deeper. What are the unique habits or patterns specific to an individual trainer that might indicate a horse is being readied for a principal target rather than just making up the numbers? One commonly used metric is the number of days since a horse’s last run. If a trainer favours a particular rest period for horses before they perform well, this can be detected in the data.
For our analysis, we’ll use the data of Sir Mark Prescott as an illustrative case. But it’s important to note that the power of this approach is even more evident when applied across multiple trainers. The metrics we’ll explore are entirely customizable within Smartform, allowing users to tailor their analysis to any trainer or racing scenario.
Analysing Success Metrics
Traditional success metrics often include win strike rates or place strike rates. However, when dealing with smaller subsets of data, such as trainer-specific statistics, a more nuanced measure like the percentage of other runners beaten can be more informative.
This metric provides insight into every race, not just those won, allowing us to detect broader trends and patterns that may signal trainer intent, and can be created on the fly with just one line of code in Smartform.
It’s also unlikely that a trainer applies the same training regime across all age groups. Therefore, we group horses into categories such as 2-year-olds, 3-year-olds, and 4-year-olds and older. When analysing days since the last run, it’s useful to group the data into evenly sized categories, allowing patterns to emerge more clearly. We can do all this with just a few lines of code, using tools like R for graphics, which integrates perfectly with Smartform.
Trainer Patterns and Boxplots
Let’s look at an example: a boxplot of Sir Mark Prescott’s performance by age group, showing the rest periods between races.
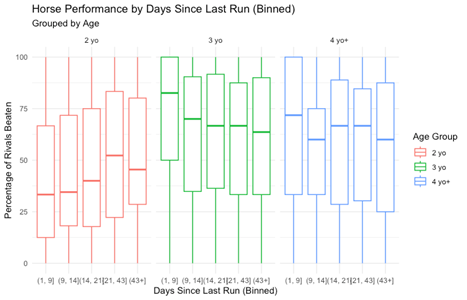
The boxplot displays the median value and the most frequent range of values bounded by the box. This visualization immediately reveals that Prescott does better with horses older than 2 years, with 3-year-olds being his sweet spot. When he turns out horses quickly—within 9 days of their last run—they tend to perform exceptionally well, particularly the 3-year-olds, who often finish in the top 20% of the field. Conversely, there’s a drop-off in performance with longer rest periods. The exception is for 2-year-olds, who show the reverse pattern, and seem to benefit from a layoff of more than 20 days, indicating that Prescott brings his two year olds to hand more slowly.
Course Preferences and Travel Distance
Next, we can analyse the courses where Prescott has had the most success. Some of the top statistics appear at locations much further from Newmarket, which suggests that he is particularly successful when he sends horses over longer distances.
The data tend to back this up, as we can see when modelling performance below by distance travelled rather than by course.
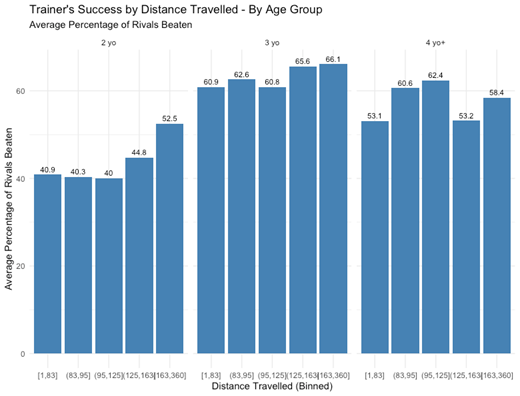
Generally, traveling a long way can be taxing on a horse, so when a trainer does this, it’s often a sign of strong intent. The data shows that Prescott’s horses tend to perform better when they travel over 100 miles compared to local races. Interestingly, his 2-year-olds are especially noteworthy when they’ve travelled some distance to the racecourse.
Race Class and Type
Another key factor to consider is the class and type of race. Trainers might enter a horse in a lower-class race following a series of high-class events, which can indicate they expect a win. Alternatively, they might be trying to lower the horse’s handicap mark, using the race as a strategic step rather than expecting a win. For example, Prescott is known for placing horses in lower-class races, sometimes over unsuitable distances, to manage their handicap marks, only to return them to a more appropriate class later for a stronger showing.
Distance and Surface Changes
Changes in race distance or surface type are also significant indicators. A sudden change might indicate a trainer’s attempt to find optimal conditions for the horse. Prescott, for instance, is well-known for running middle-distance horses over shorter distances initially to lower their handicap marks, only to excel when they later run over more suitable distances. Similarly, switching from turf to all-weather tracks (or vice versa) can signal that the horse is ready to perform well, particularly if the trainer has a strong record on a specific surface.
Detecting Patterns for Handicap Adjustments
When analysing trainer behaviour, it’s crucial to recognize patterns aimed at adjusting handicap marks. Prescott’s data shows that his horses often improve when they are placed over longer distances or when moved up in class. This contrasts with the behaviour of many other trainers, whose horses may perform better when dropped in class.
Jockey Selections and Trainer Intent
Finally, one of the most telling signs of a horse’s likely performance is the trainer’s choice of jockey. By analysing the trainer’s history with specific jockeys, we can infer the level of intent. A top jockey booking for a horse that appears out of form can signal that the trainer believes the horse is ready to win. Conversely, if a less experienced jockey is booked, it might suggest that the horse is not expected to perform well in that particular race.
However, to further enhance your analysis of trainer intent, it’s crucial to consider jockey bookings for the day, as these can reveal which horse a jockey may be traveling specifically to ride. By examining a jockey’s engagements across all races at a meeting, bettors can distinguish between primary rides and “filler” bookings.
For instance, when a top jockey like Luke Morris has multiple rides at a meeting, Smartform allows you to assess which trainer-jockey combinations have historically yielded high strike rates. This analysis can indicate that the jockey is likely traveling to the course primarily for a particular horse, potentially signifying a strong expectation of performance from that runner.
Conversely, lower strike rates with other trainers on the same day might suggest that those rides are secondary and less likely to result in a win. This information can be a valuable factor in evaluating a horse’s chances or even identifying lay candidates.
For a detailed breakdown of how to perform this analysis using Smartform, you can explore the article titled “Trainers’ Intentions – Jockey Bookings” by Henry Young. This brief guide provides the necessary SQL code and methods to analyse jockey bookings effectively with Smartform.
While we’ve focused on Sir Mark Prescott as an example, the strategies outlined here are broadly applicable to any trainer. Smartform’s flexibility allows users to apply these methods to analyse any trainer’s patterns, helping to decode their strategies and make more informed betting decisions. By understanding the nuances of trainer intent—through race selection, rest periods, travel distance, class, and other changes, combined with jockey choices—bettors can gain a significant edge in predicting trainer intent.
Of course, these insights are just the beginning. Trainer intent is a strong foundation, but to fully capitalize on this information, one must also consider the form and characteristics of the horse itself, along with those of every other competitor and their connections in any given race. With Smartform, you have the tools to dig deeper, analyse comprehensively, automate and ultimately refine your betting strategy to achieve better outcomes.
Related content – https://blog.betwise.net/2026/04/13/new-daily-trainer-stats-how-todays-runner-fits-the-trainers-patterns/
Colin Magee – www.betwise.co.uk