
Encoding Winning Form as a Predictive Score
Assigning scores to horses based on their recent form is a familiar practice in system-building. From basic shortlists to more involved rule-based models, the idea is usually the same: summarise a horse’s past performances into a single, actionable figure.
One well-known example was the Fineform score, which we’ve written about before and placed significant emphasis on a horse’s last two form figures. It often produces useful results as a rapid guide to form chances any race, but the logic behind the score weights is not transparent.
In this article, we take a slightly different approach. Rather than guessing what the weightings should be, we ask:
- What does the data tell us about the relationship between recent wins and future win probability?
- Can we accurately base a score on this relationship?
- How useful is it?
We’re focusing specifically on winning form, and specifically the last three runs. These are recorded as binary flags — 1 and 0, won or didn’t win — and are available as standard fields in the Smartform database:
- won_LTO (Last Time Out, the horse’s most recent run before today)
- won_PTO (Penultimate Time Out, or two runs ago)
- won_ATO (Antepenultimate Time Out, or three runs ago)
These fields are available both historically (historic_runners_insights) and for upcoming runners (daily_runners_insights), making the resulting scoring system easy to implement, backtest, automate, or use to generate daily shortlists. At first glance, representing recent wins as binary flags might seem like a blunt tool. But when combined into patterns a consistent predictive signal emerges.
Encoding Recent Form as Binary Patterns
To begin, we represent a horse’s last 3 runs using a simple binary format:
- 1 = the horse won that race
- 0 = the horse did not win
We label each run as:
- LTO = Last Time Out
- PTO = Penultimate Run
- ATO = Antepenultimate Run
So, a pattern of 101 would mean:
- Won LTO
- Did not win PTO
- Won ATO
There are 8 possible combinations of three binary outcomes (000 to 111). We then calculated the future strike rate for runners matching each pattern.
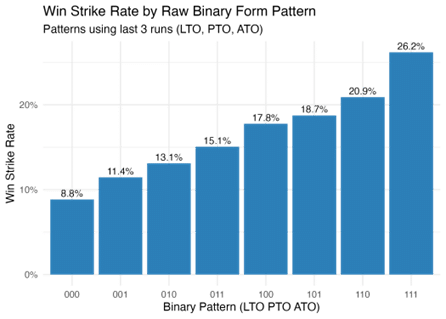
This chart clearly shows a positive and nearly monotonic gradient: the more wins in the recent 3 runs, the better the win strike rate in the next run. For example:
- 000 (no recent wins) has a strike rate of just 8.9%
- 111 (won all 3 previous races) has a strike rate of 26.2%
This is intuitive — but keeping several binary patterns isn’t ideal for modelling, because each pattern is a separate category in a model which increases complexity and makes generalisation harder. It doesn’t lend itself to use in a system either, which is our objective.
Creating a Weighted Form Score
To generalise this information into a single number, we created a form score by applying weights to each recent race.
- LTO × 4
- PTO × 2
- ATO × 1
This gives a score ranging from 0 to 7. For example:
- Pattern 000 = 0
- Pattern 101 = 4 (LTO win) + 0 (PTO) + 1 (ATO win) = 5
- Pattern 111 = 4 + 2 + 1 = 7
This system captures both the number of recent wins and their recency, giving more weight to more recent form.
We then recalculated win strike rates using form score, and show this alongside the binary patterns below (in green):
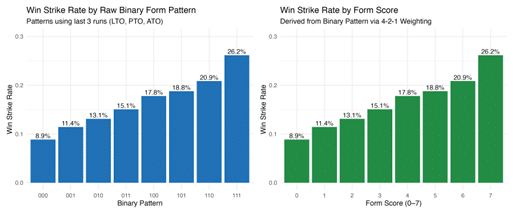
Again, we see a near-perfect ascending trend — from 8.9% at Score 0 to 26.2% at Score 7.
|
The rest of this article is for Platinum members. You've just seen what our experts do with publicly available data — the Platinum section is where the specific angles, numbers and actionable conclusions live. Platinum members also get daily system selections in their inbox by 2am, tips from top tipsters, Win Big Golf selections, and access to 11 years of magazine archives. |