
Has anything changed at Glorious Goodwood in the past few years?
A few days after this latest edition of On Course Profits comes out, I will be heading to the first day of Glorious Goodwood. Goodwood is my favourite course for many reasons.
Firstly, it was the first racecourse I ever went to, and I was immediately hooked when bagging a 33/1 winner in the last race.
Secondly it is set in the idyllic South Downs with a lovely backdrop. Thirdly, I was lucky enough to be asked to do the tips in the Goodwood Racecard for a couple of years which was a real honour.
In this article I am going to compare the last nine years of the Glorious Goodwood meeting with the previous nine, to see what, if anything has changed. Now, I would like to have used two blocks of ten years, but I only have the last 18 years of data to work with. My primary focus will be to see if specific patterns that occurred in 2008 to 2016 for example reappeared between 2017 and 2025.
Thanks to the www.horseracebase.com site for providing all the numbers to crunch. I am going to be using Betfair SP for any profit / loss figures with a 2% commission applied.
The Market
My first port of call is the betting market, and I would like to look at the results for favourites across both 9-year spells, but before I do let me share the overall figures for Betfair favourites across the whole 18 years:

As we can see, favourites have done very well from 2008 to 2025. It is very rare to see a profit over such a long period, and a pretty decent one at that. The A/E index of 1.12 is high and suggests favourites have been excellent value.
Before, I start looking at some 9-year comparisons let me look at the overall 18-year splits for favourites in handicaps versus non handicaps and then market leader results by Race Class.
Handicaps / non handicaps first:

Favourites in non handicaps have provided virtually all the profit figures over these 18 years. What about Race Class? The table below shows the splits:
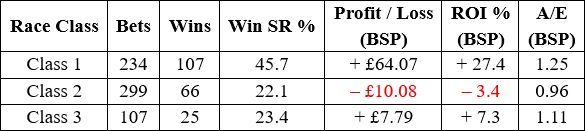
Favourites have had a superb record in Class 1 events over the past 18 years of the meeting with a better than 27p in the £ return to £1 level stakes.
OK, we have three sets of 18-year favourite stats to break down so let me start with the overall figures for all favourites in all races across the two 9-year time frames:

Now this is interesting. Favourites have done far better in the last nine years than the first nine. To be fair the figures for 2008 to 2016 are still pretty good hitting close to break even. However, the figures for favourites from 2017 to 2025 have been outstanding.
It just shows that trends and patterns can change and a time frame of nine years may sound a lot, but in reality, it might not be, as far as an individual meeting like Glorious Goodwood is concerned.
Trend analysis of big meetings and individual races has become very popular in recent years, but what these stats show is that we cannot just use past trends blindly expecting them to match up perfectly in the future.
Time to see how the handicap / non handicap results have split:
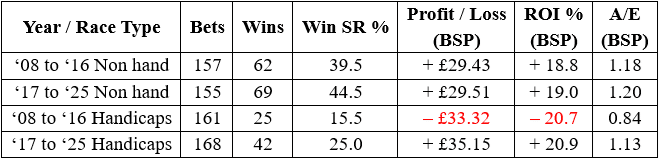
The results for favourites in non handicaps have been similar across both time frames especially in terms of profits / returns and A/E indices. The big difference has been in the handicaps. Favourites in handicaps performed poorly between 2008 and 2016 and very well between 2017 and 2025.
A look at the Race Class data now:
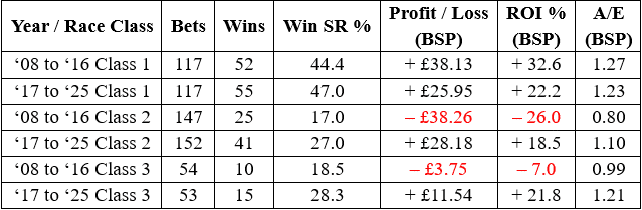
The Class 1 events have seen favourites perform very well in both individual time frames, while the Class 2 events have seen a huge switch from favourites struggling in 2008 to 2016 to doing well in the following nine years.
Of course, the hardest thing perhaps is to predict what will happen this year, and in subsequent years. Based on all the evidence of the last 18 years, it seems sensible to think that the favourite could offer us value in Class 1 events and/or non handicap races.
The thing about race meeting trends over a period of time is that individual years can fluctuate massively due to small data sets. For example, let me share the combined record of second and third favourites at the meeting over the past four years:
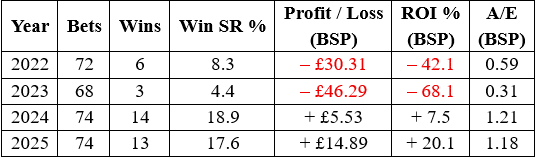
As the table shows, there has been a huge contrast between 2022 and 2023 figures compared with the last two years of ’24 and ’25. You will not be surprised to know based on the favourite stats, that second and third favs did better in 2008 to 2016 than 2017 to 2025.
Indeed, between 2008 and 2016 second and third favs combined to make profitable returns of over 8 pence in the £, but between 2017 and 2025 this turned into a significant loss of around 21p in the £.
The Draw in 7f Handicaps
Traditionally the 7-furlong trip at Goodwood has offered lower to middle draws a fair edge with higher draws struggling. I thought it would be interesting to compare the draw data for 7f handicaps over the two 9-year time frames.
Firstly, let me show the splits for the whole 18 years. For the record there were 49 qualifying races, and I am splitting the draw results in half:

The overall pattern is what I expected based on the long-term course data for all meetings. The lower stall positions in the bottom half of the draw have been the dominant force by some way showing clearly best across the main metrics.
So, it is time to see whether this draw bias has changed in any way when comparing the two 9-year time frames:
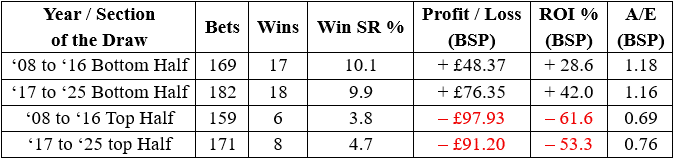
The splits correlate with each other extremely well suggesting the bias has stayed pretty consistent across the years.
Hence, in the 7f handicaps this year we would ideally want our fancied runners drawn low to middle and not high.
|
The rest of this article is for Platinum members. You've just seen what our experts do with publicly available data — the Platinum section is where the specific angles, numbers and actionable conclusions live. Platinum members also get daily system selections in their inbox by 2am, tips from top tipsters, Win Big Golf selections, and access to 11 years of magazine archives. |