The Flying Dutchman – Fact or Fiction?
Hi All
For those of us of a certain age who were involved in punting on the horses’ way back in the day (circa 40 years ago) the Flying Dutchman or Van Der Wheil will bring back many memories, some positive and plenty of frustration!
Like many of us buying printed matter was the norm and each week I would read the Sporting Chronicle Handicap book from cover to cover. The publication included a pull out section detailing all of the recent results and I avidly collated them into a folder to be scribbled on following the latest “system” or discovery on my path to punting glory.
The weekly paper contained a readers letters section which soon led to the enigma that became known as the “Flying Dutchman” following an inclusion of a series of drip fed titbits pertaining to outline a highly profitable method.
The main issue became apparent though as all of the winners that were detailed had in fact already won and the process that was claimed to have been used to find these outstanding wagers was hinted at in sufficient detail to engage the reader without actually being clear as to how to go about it.
In subsequent years blogs have been spawned and books have been printed claiming to have uncovered the “missing links” and numerous ratings sites have gone on to include aspects of the process based on their interpretation of “Form” and “Ability”.
The basis of the VDW ratings
This version was kindly shared by the folks at Inform Racing
Ability Rating
The ability rating is used to find the class of each horse in a race and can be calculated quite easily by dividing the amount of winning prize money each horse has won by the number of wins.
So a horse that has won seven races and a total of £175,000 for these wins (not place money), will have a VDW rating 25,000. You would then divide this number by 100 to get a final rating of 250.
Another horse may have won ten races before with a total winning prize fund of £42,000 and this would give that horse a rating of 4200 or 42.
So you can see that it is not how many races the horse has won, it is the average of prize money he has won each time and is in itself a very good way of looking at a horses class.
In the two examples above the first horse has won in races with an average prize fund of £25,000 whilst the second has been winning races on average worth just £4,200 and just from this you can see which horse has been winning the better races.
Form Rating
Van Der Wheil also said that consistent horses, or those who consistently performed better should command interest and his second formula was a very simple one that looked at a horses last three runs.
Simply by adding up the last three form figures and given anything over 10, or that was a letter such as F for Fell or P for Pulled Up, a rating of 10 you can get the form figure for each horse.
So a horse that won its last three races would score 3, 1 + 1 + 1. A horse that had form figures of 72F would score 19.
By taking horses in a race that were in the top 3 for both the ability and form ratings, VDW said you can narrow down the field to those that have the best class and those in best form.
Other Factors
In the series of letters to the weekly publication there were references made to certain other pertinent factors such as the position in the betting where it was claimed that 83% of the horses in the top 5 in the betting market won the race.
In a very recent publication Van Der Wheil – A strategy guide the folks at Race Advisor carried out some research and found the following:-
- 2019 – 83.15%
- 2020 – 83.11%
- 2021 – 83.45%
- 2022 – 85.27%
In a nutshell that confirms that the original premise still holds good!
VDV also claimed that the top 2 in the betting market won over 50% of the races…..
- 2019 – 53.35%
- 2020 – 52.50%
- 2021 – 53.57%
- 2022 – 55.11%
Another VDW claim that still appears to ticks the boxes in more recent times.
The original content also hinted at a focus on the better quality races primarily as these had more consistent outcomes pertaining to the best form and market position.
Whilst it was never clearly detailed the inference was that the VDW approach focussed on the main meeting of the day and the most valuable contests on that card.
If we wind forward to the present day and muse over the apparent VDW approach, again with reference to the folks at Race Advisor, we find the following:-
Question 1
If the first or second favourite is top rated for ability and form ratings does this guide us on a path to profits!
The answer is no!
For favourites, who have a winning percentage of 35% and a ROI of -1%, if they are also top with the form rating, the win strike rate moves up to 40% and a -0.75% ROI.
If they are also top on the ability rating the win strike rate goes up to 46% but the ROI dips back to -2.07%.
That poses a second question….why would the ability rating be achieving a higher win strike rate yet makes a loss?
We would suggest that because of the increased availability of this kind of information it may lead to these types of runners being over bet and therefore the average prices would decrease relative to their respective chances.
Having analysed thousands of permutations the folks at Race Advisor appear to have found a path to incorporate aspects of the “Flying Dutchman” approach with a modern twist and we wish them well with their endeavours.
For our part we will end this piece with punt on the VDW premise by considering the following:-
Saturday Racing
Outside of the big Festivals the vast majority of the better quality races are run on a Saturday
Handicap Races only
The official handicapper allots a rating which in turn determines the weight carried, ignoring claims, in these races and in theory the best horse will carry the top weight.
Ability Rating
The aforementioned ability rating, with a few sensible checks, should determine the horse that has the highest class based on the value of the races it has won.
Jumps meetings October through to April
This incorporates the main part of the National Hunt campaign during which the top yards run their best horses on going more suited to the jump bred horses.
Race Class 3 or higher
The objective was to focus on the best handicap races and consider the runners that were both the highest rated in terms of OR and Ability Rating.
We ran the above criteria through the Inform Racing systems builder and found the following: –
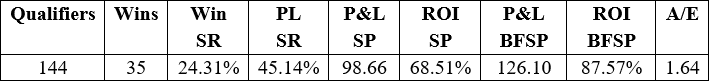
The above represents the results since the start of 2020 and it would seem to point to a potentially profitable strategy.
With the 2022 National Hunt campaign about to begin in earnest at the start of October we will notify Platinum members of the qualifiers in the Saturday OCP Platinum Members bulletin.
Steve Carter