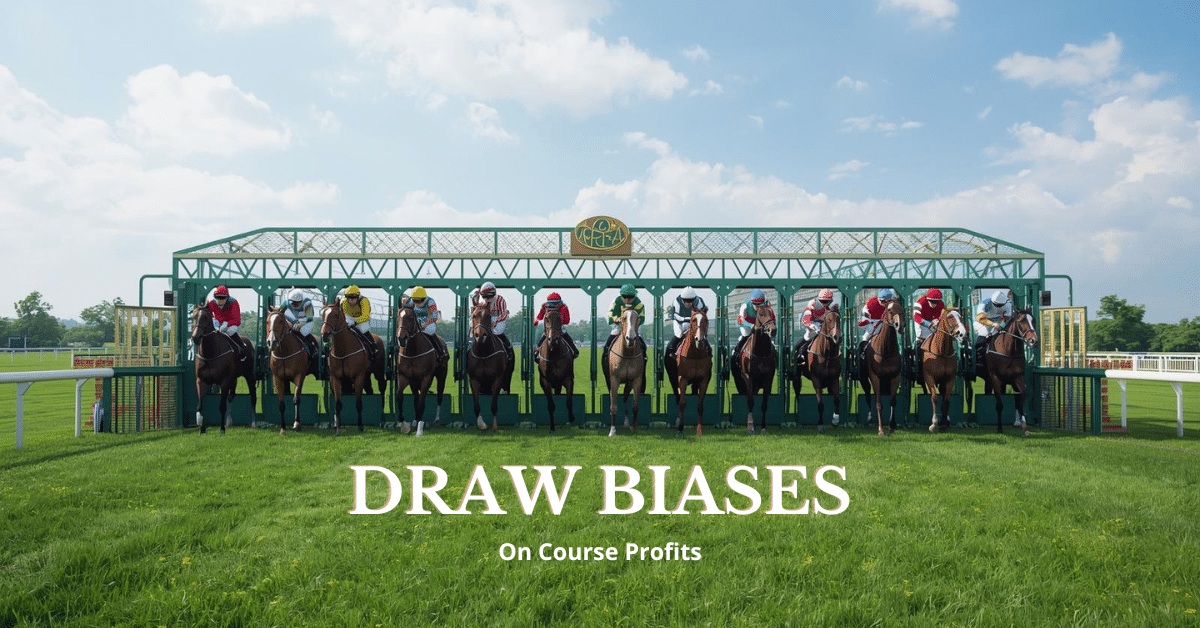
The Strongest Draw Biases Over 1 Mile or More
As the flat season kicks fully into gear I am going back to focusing on some draw bias data that I would like to share with you. In the 1980s and 90s before draw bias became well known to the masses, the opportunities to exploit it and make money was huge. For me, that period coupled with first few years of the Noughties, provided me with several value betting opportunities resulting in consistent profits. However, as with so many good things, when a value method becomes more widespread and better understood, the edge begins to dissipate.
This article is part of our Complete Draw Bias Guide — covering every UK course and distance in one place.
This is very much an example of something we would know as ‘shelf life’ - good ideas gain an edge because the majority of people do not use it. As time passes however, the betting public and the more importantly bookmakers become aware and catch up. As a result, the prices start to contract on the horses that were incorrectly priced and the value we once had goes. In general, this is what has happened with many course draw biases over time. Also, it is fair to say such biases are less prevalent now than 25 years ago, due to far better watering systems and the regular moving of running rails at some tracks.
The draw biases that I made the most money on back in the day were often over the minimum trip of 5 furlongs mainly because the ground closest to a favoured rail was quicker than the rest of the course. 30 to 40 years ago 5-furlong races at Beverley, Thirsk and Lingfield (on the turf) were three such courses where this type of bias occurred. These days some of the strongest biases are over longer distances and, in this article, I am going to share what I perceive to be the five strongest draw biases over a distance of 1-mile or more.
Data has been taken from UK turf flat racing spanning 2019 to 2025 with the focus being handicap races as they give us more dependable draw data. I will also ignore races with very small fields because we need bigger fields for any meaningful draw bias to take effect. Hence, I will only be ‘crunching’ data for fields of eight runners or more. In order to get meaningful sample sizes, I will only look at C&Ds that have had at least 40 qualifying races over the period of study.
When analysing each handicap race, I am going to start by dividing the draw into ‘thirds’ - those drawn in the bottom third (low), those drawn in the middle third, and those drawn in the top third (high). It should also be noted that the draw positions are adjusted when there are non-runners – for example if the horse drawn 2 is a non-runner, then the horse drawn 3 becomes drawn 2, draw 4 becomes 3 and so on.
On a completely fair course each ‘third’ of the draw should have winning percentages a smidge above the 33% mark. The differences in the percentages will help to give us an initial guide to the strength of the bias. I am also going to share the PRBs (Percentage of Rivals Beaten) as this metric is arguably the most significant when it comes to analysing potential bias.
One more thing to note before digging into the course and distance data, is that if a draw bias exists there tends to be two ‘types’.
Firstly, a clear bias towards one specific section or third of the draw; this is the strongest possible type of draw bias.
Secondly, we can get a bias against one specific section of the draw where one ‘third’ or even ‘half’ of the draw is at a disadvantage.
I will look at the C&Ds in reverse order starting with what I think has been the fifth strongest:
5. Hamilton 1-mile ½f
We start in Scotland over the extended mile at Hamilton. There were 80 qualifying races during the time frame so a decent sample. Here are the draw splits by ‘third’:
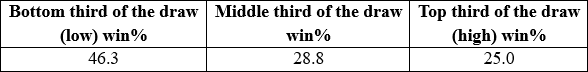
According to the win stats low draws have a clear edge, and when we split the draw in half, we see the lower half having 54 wins and the top half just 26. In percentage terms that is 67.5% of the bottom half, 32.5% for the top.
In simple terms horses drawn in the lowest half of the draw have been slightly more than twice as likely to win as those drawn in the top half. The lowest draws are positioned next to the inside rail, so it makes sense on a turning track that have an edge.
The PRBs help to complete the picture:
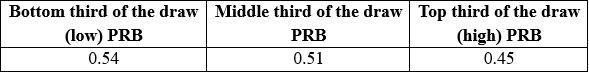
The lowest draws are best, but middle draws are not too far behind. That correlates with the splitting the draw in half data shared earlier.
The highest draws have been at a disadvantage and digging deeper we can see that in bigger fields the very highest draws have had virtually no chance. Horses drawn 11, 12, 13 or 14 have combined to win just once in 68 attempts with only four others managing to place (PRB 0.37).
Final stat to share for Hamilton is that horses drawn 1 and 2 (the lowest two stalls) have combined to produce a strong PRB of 0.56.
|
The rest of this article is for Platinum members. You've just seen what our experts do with publicly available data — the Platinum section is where the specific angles, numbers and actionable conclusions live. Platinum members also get daily system selections in their inbox by 2am, tips from top tipsters, Win Big Golf selections, and access to 11 years of magazine archives. |