Horse Racing Trends
Ten Year Trend: Sorting Out The “Wheat from the Chaff” – Part Two
Why ten years?
This is part two of a three-part series looking at using ten years trends in your betting. Before I get into the main part of this month’s article. I want to deal with one thing that emerged from part one.
Someone asked me, Why I used ten-years in the title? It’s a good question and there are three main reasons why I used it.
Firstly, most people quickly understand what is meant by ten-year trends. It’s the phrase most often used. You don’t hear many people saying 5-year or 20-year trends when looking at a big race from a trend’s perspective.
Secondly, it’s all about the sample size. The bigger the sample size the more likely you are to have confidence in the accuracy of that stat or trend. If you are looking at say just five years’ worth of results you may not have enough data to work with.
It always worth reminding yourself that the value of any statistic lies purely in the sample size.
Looking at the Epsom Derby. I can go into a database like www.horseracebase.com and look at the last twenty running’s of the race:

Or I could look at just the last ten-years:

Or I could just look at the last five renewals of the race:

The five year one wouldn’t really give me a large enough sample to be confident of the accuracy of my findings.
Clearly the more established a race is, the more validity you can give to trends analysis.

That leaves working with either the 10-year or 20-year trends. Now the one to go with should be the twenty year one, given we have almost twice as many results to work with or should it? This links in with my final reason for using the ten-year figure.
Finally, it’s all about relevance. What might have been an important trend ten years ago may not be now.
For example, the distance of a race can change, in January we had the Lanzarote Handicap Hurdle at Kempton. The race used to be run over 2m but in 2007 the distance was changed to 2m 5f. Using 20-years’ worth of trends would be a total waste of time given the big change in race distance. Now that’s a rather extreme example in action but you will get my meaning.
The Grand National is another race where trends have changed in recent years. The recent increase in prize money combined with the easing of the fences means the nature of the race has changed from what it was like say fifteen years ago.
That’s not to say we can’t still use trends to reduce the field down from 40 runners to a smaller shortlist. It just means the trends that where relevant in the past may not be now.
In short, it’s all about striking a balance between sample size and continued relevance when it comes to trends.
Keep it relevant.
As I mentioned last month. The key remains to sort the “wheat from the chaff’ or the relevant from the irrelevant.
You will see plenty of pundits use ten-year trend type stats. You may hear someone on one of the racing channels, say favourites have won a particular selling hurdle at Fakenham, just once in the past ten-years.
Here’s what I mean.
On Friday 15th February we have a selling hurdle on the Fakenham card with the Ashwicken Selling Handicap Hurdle over 2m. This race has nine years of history and as you can see from the Racing Post, just one favourite has won the race since 2010.
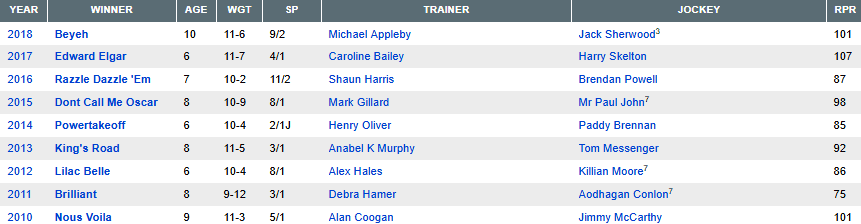
Now would you rely on that stat? Plenty of punters would. Well I wouldn’t. To rely on that would be folly as there is no significance with the past nine running’s of such a minor race like this Fakenham race.
Why do I say that? Well for a start the sample size is too small and the timescale too large for such a small sample. If you want to look at the fate of favourites, in a particular race like the one highlighted then you would be advised to look further. I would want a bigger sample and to get that I would look at similar races at the track in the past 10-years.
Here’s how I would go about it. I would look at the results for all handicap sellers at Fakenham! For that I once again turn to the ever reliable www.horseracebase.com.
As you can see since the start of 2008 there have been 36 selling handicap hurdles at Fakenham:
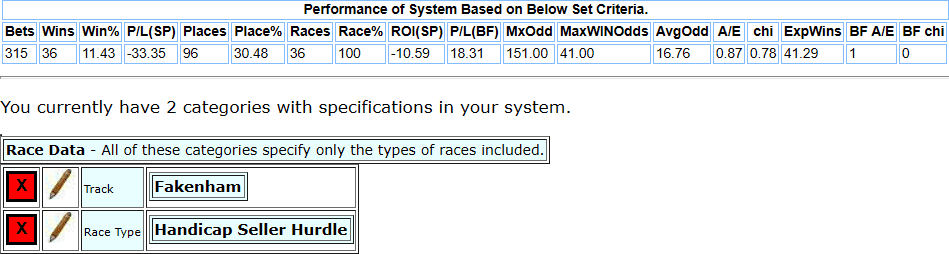
What we immediately have is a much bigger sample size to work with, than just the results for our highlighted race.
Now let’s focus on the fate of the favourites?
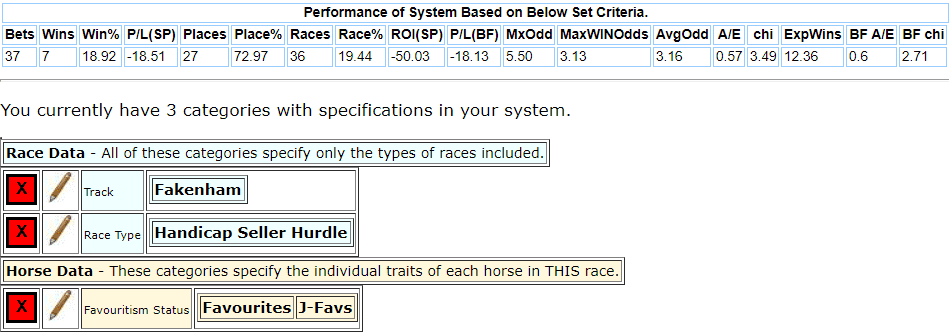
As you can favourites have won 19% of all selling handicap hurdles at Fakenham from 12% of the total runners.
Now you wouldn’t make money backing every favourite in such races at the course, far from it.
However, at least you know that you dealing with a more solid stat than looking at the 10-year trends for the one individual race.
There are occasions when you can rely on favourite stats for an individual race. They tend to be the higher-class of race which attract plenty of punters to have a bet.
Let me illustrate this with another working example. On Saturday 16th February we have Betfair Ascot Chase (Grade 1) at Ascot.
Looking at the ten years trends for the race:
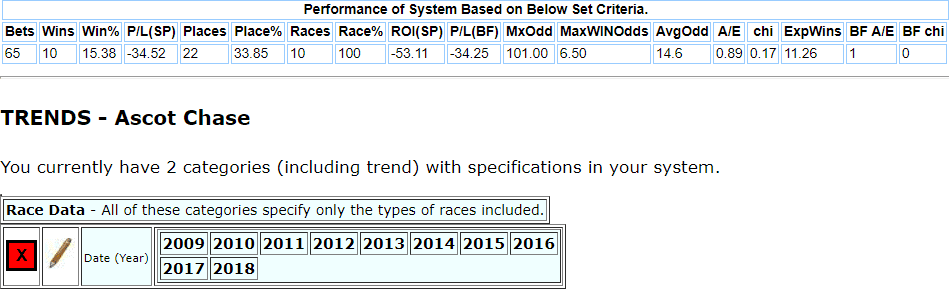
Turning to the fate of the favourite:
Eight of the last ten renewals of the Ascot Chase have been won by the favourite! Now, for me that that’s a very significant stat and it’s also backed up by the high Chi score.
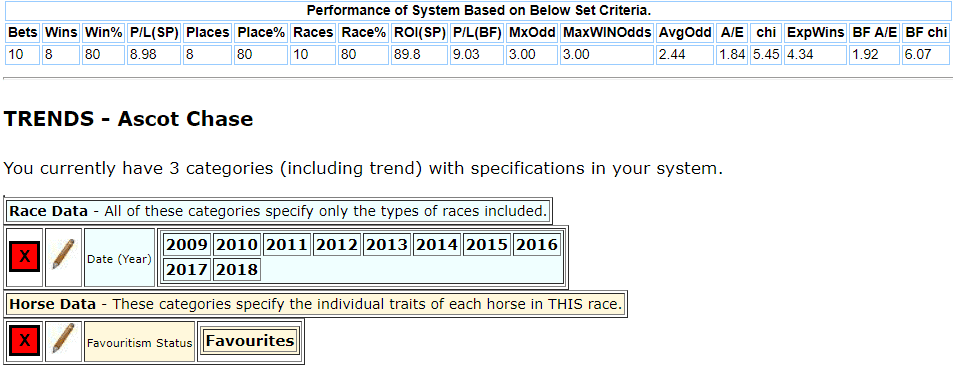
Digging further we can look at the fate of the favourite in all Ascot Grade 1 Chase over the same time period.
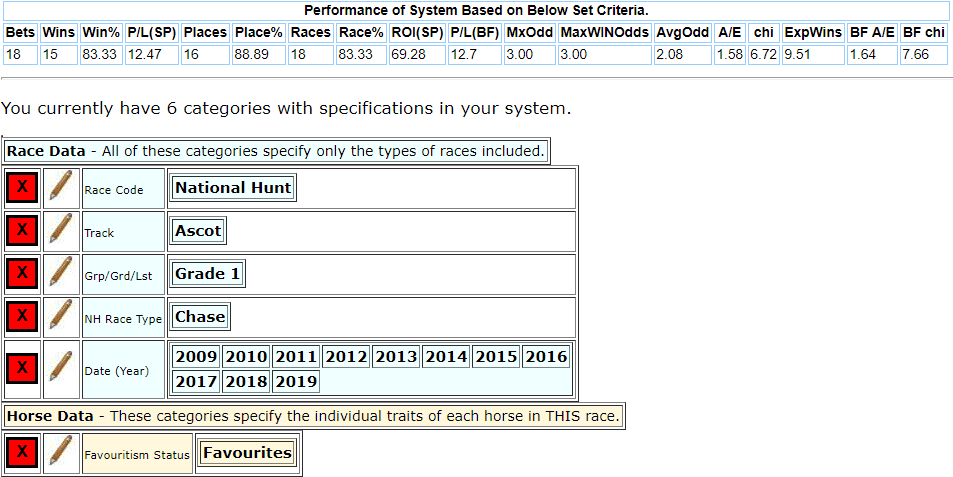
Now granted there are not many Grade 1 chases at Ascot each season but you can see from the above results that favourites have a very good record in such races.
Now you’re probably thinking I have used above race and type as an example because favourites have such a good record. That’s not the case at all. I‘m not suggesting you should back favourites in Grade 1 chases at Ascot, although it would be profitable to do so, but it hopefully gives you a clearer picture as to why individual trends are useful when it comes to looking at big races rather than a selling hurdle at Fakenham.
It’s all about the sample size.
I mentioned earlier that’s why I go for ten-year trends when it comes to individual big races.
However, there are times when the sample size is big enough that you can use just five-year’s worth of trends.
For example, let’s look at the fate of the favourite in all National Hunt, non-handicaps since the start of 2015.
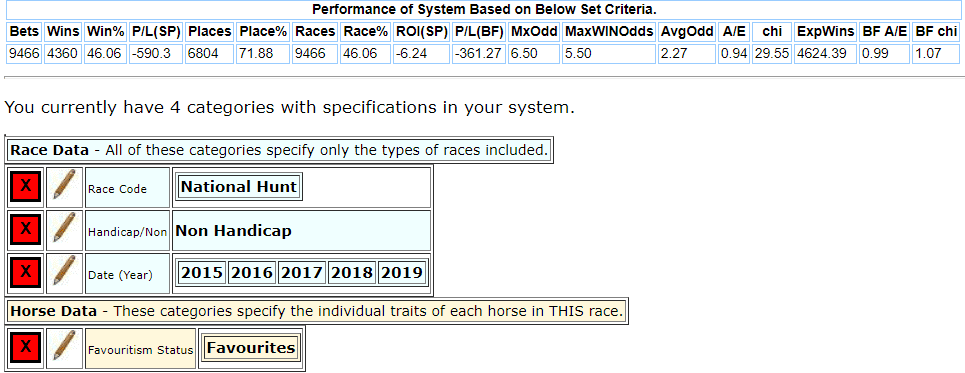
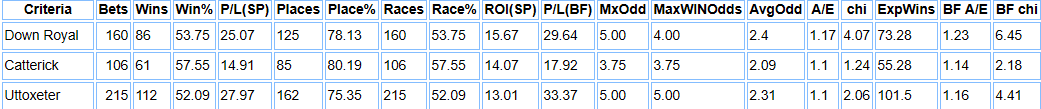
As you can see favourites have won 46% of NH non -handicap races in the period under study. Now if you dig a little further and look at the fate of the favourite by track. For the purposes of this example and for sample size I have only used those racecourses with 100+ qualifiers and ordered them by the highest A/E.
The top three racecourses for non-handicap favourites are:
You might be wondering why I have just used favourites for my various examples.
It’s very simple.
It’s the only time I would consider looking at 10-year trends outside of big races, even then, I wouldn’t just use the favourite trends for one individual race I would be looking at analysing similar races over the track to get a better sample size.
In summary, one has to be cautious when using 10-year trends.
They are meaningless when it comes to analysing minor day to day to races. However, if you want to use them make sure you are analysing similar types of race to get a decent sample size.
Next month, in the final part of this series, i will be focusing in on the use of ten-year trends in big races and when you should be using them.
I will go through step by step how I approach a race and why less is indeed more when it comes to big race trends analysis.
Until next month.
Read part 1 here https://www.oncourseprofits.com/ten-year-trends-sorting-out-the-wheat-from-the-chaff-part-one/