Major Mistakes in Chases
A closer look at why and when jumping errors happen.
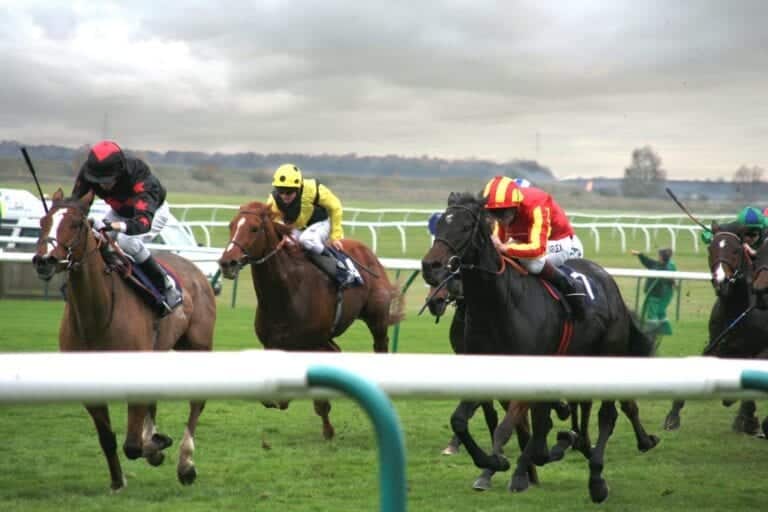
As we get into the heart of The Winter Game, I’ve been analysing data around good and bad jumping performances. It’s very easy when faced with a large variety of racing types all offered up on the same card to ignore the specific attributes required of different racing types, but of course Chase races could not be more different, both in terms of the physical specimens that compete and what is required of them. Relative ability to jump fences well, clearly, is right up there! A horse making mistakes, clouting a fence, unseating its rider, or falling, will, in varying degrees ruin any betting endeavour. And yet, in most analyses, jumping ability is treated as a fixed trait, a tick in the “jumps soundly” box or a concern noted in the commentary.
However, it’s impossible to research this effectively on an individual competitor level without looking at the wider context for any horse jumping well or badly. So, is there more we can say, statistically, about when jumping errors are likely to happen? That’s what we’ve set out to explore this month. We’ll look at the data across tens of thousands of races, compare how things have shifted over time, and unpick some surprising effects along the way in the interests of informing better punting on Chases all round.
Building a Model of Jumping Risk
We began with a cleaned dataset of over 30,000 UK and Irish Chase races from Smartform from 2010, each one parsed for in-running comments that include jumping-related phrases.
From this, we identified and classified serious jumping errors, falls, unseated riders, bad mistakes, and blunders, at the runner level, then aggregated these to the race level. Falls, unseating events and major blunders give us a baseline of difficulty per race, removed from the runner data, and exclude minor mistakes to tell us more about the race itself. But how do we compare one race to another fairly?
The key is exposure: a race with 5 fences and 3 runners has just 15 opportunities for a major jumping error. A race with 18 fences and 16 runners? That’s 288. So rather than model errors per race, we modelled them per jumping instance, effectively normalising by number of runners × number of fences. We then fitted a simple Poisson model, and later a Negative Binomial model to account for overdispersion, that predicted the expected number of major errors per race, based on:
- Number of runners
- Number of fences jumped
This gives us a way to adjust for the natural variation in race types, longer races and larger fields will naturally produce more errors.
Observing the Pattern: Exposure vs Errors
At this point, we have a sensible way to normalise jumping risk across races of very different shapes. The next step is to ask whether a simple statistical model can capture the relationship between exposure and observed errors in the data. The plot below shows the number of observed major jumping errors on the y-axis, against the calculated exposure (runners × fences) on the x-axis, shown on a log scale to help spread out the points:
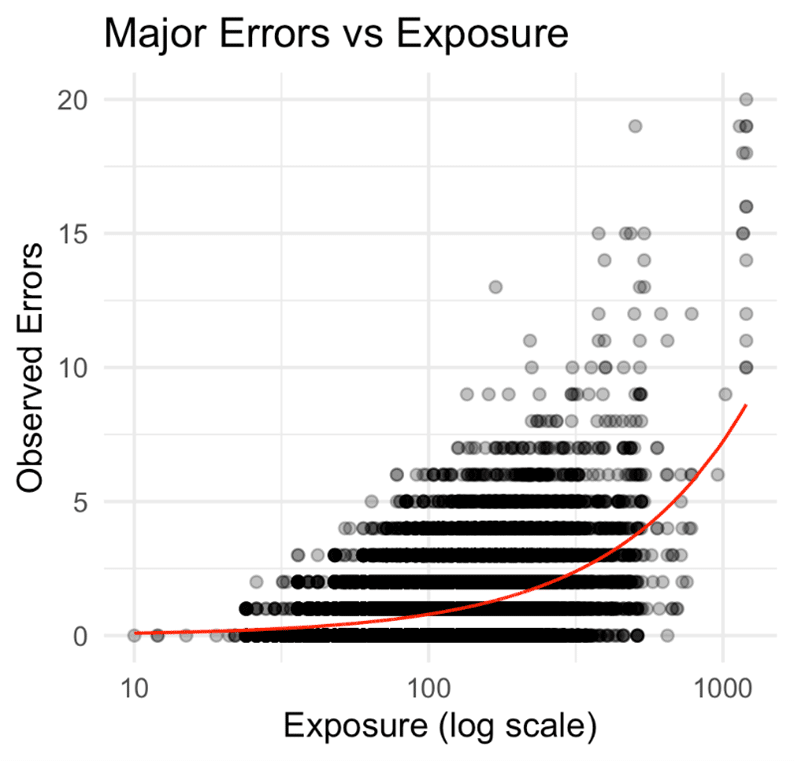
The shape is clear: the relationship between exposure and error count is far from linear. While the majority of low-exposure races record zero or one serious error, things begin to change as exposure rises, particularly beyond the 200–300 mark.
What’s especially notable is that the number of errors accelerates as exposure grows. In larger fields with more fences, we don’t just see more jumping, we see disproportionately more major mistakes. This makes intuitive sense: bigger fields increase the chances of congestion, more awkward take-off positions, and added psychological pressure on horses and riders.
We can also note a possible inflection point around 14–15 runners where the race dynamics themselves may change in this regard.
From exposure to a working baseline model
We started with a Poisson model, using log(exposure) as the sole predictor. Conceptually this is the natural first choice: we are modelling counts of relatively rare events, scaled by the number of opportunities for those events to occur.
The Poisson model broadly captured the upward relationship between exposure and total errors, but a quick diagnostic check revealed a problem. The observed variance in errors per race was materially higher than the mean. In other words, the data are overdispersed relative to a Poisson assumption. This isn’t surprising: jumping errors are not independent coin‑flips. Races cluster into low‑error and high‑error outcomes for reasons the Poisson model cannot capture.
To address this, we moved to a Negative Binomial model, retaining the same structure but allowing for extra dispersion.
Crucially, this model now gives us a credible baseline expectation:
given only the number of runners and the number of fences, how many serious jumping errors should we expect in a race?
That baseline can be used in several ways:
- As a lookup table for expected errors by race configuration
- As a normalising device for comparing individual errors in races
- As a reference point for asking what the model doesn’t explain
It’s that last use which turns out to be the most immediate and most interesting.
Extending the Base Model and Evaluating Course Effects
We know from experience that not all courses present the same jumping challenge. A circuit at Worcester is not the same proposition as one at Aintree or Cheltenham.
If we are to build a fair jumping index at the horse level in future, we would want to account for the fact that an error-free round at Cheltenham may indicate a stronger jumping performance than the same at a minor track. This raises the question: should course be explicitly included in the model?
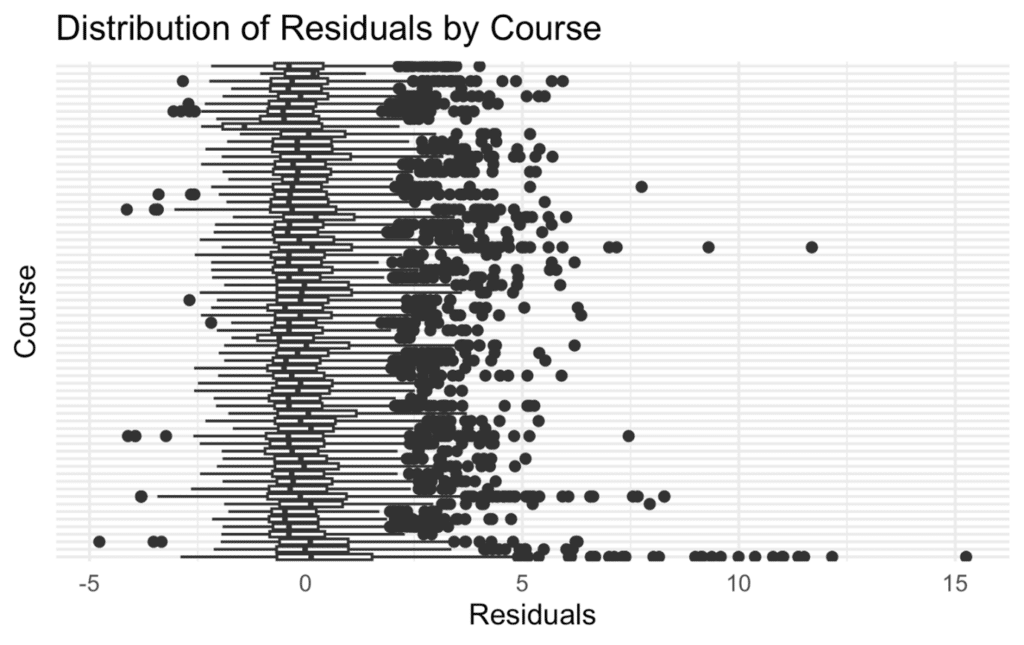
To assess this, we examined the residuals from our base model and how they varied by course. If some courses consistently show positive or negative residuals — i.e., actual errors exceeding or falling short of model expectations — that would indicate the model is systematically under- or over-predicting at certain tracks.
The shape is clear: the relationship between exposure and error count is far from linear. While the majority of low-exposure races record zero or one serious error, things begin to change as exposure rises, particularly beyond the 200–300 mark.
What’s especially notable is that the number of errors accelerates as exposure grows. In larger fields with more fences, we don’t just see more jumping, we see disproportionately more major mistakes. This makes intuitive sense: bigger fields increase the chances of congestion, more awkward take-off positions, and added psychological pressure on horses and riders.
We can also note a possible inflection point around 14–15 runners where the race dynamics themselves may change in this regard.
From exposure to a working baseline model
We started with a Poisson model, using log(exposure) as the sole predictor. Conceptually this is the natural first choice: we are modelling counts of relatively rare events, scaled by the number of opportunities for those events to occur.
The Poisson model broadly captured the upward relationship between exposure and total errors, but a quick diagnostic check revealed a problem. The observed variance in errors per race was materially higher than the mean. In other words, the data are overdispersed relative to a Poisson assumption. This isn’t surprising: jumping errors are not independent coin‑flips. Races cluster into low‑error and high‑error outcomes for reasons the Poisson model cannot capture.
To address this, we moved to a Negative Binomial model, retaining the same structure but allowing for extra dispersion.
Crucially, this model now gives us a credible baseline expectation:
given only the number of runners and the number of fences, how many serious jumping errors should we expect in a race?
That baseline can be used in several ways:
- As a lookup table for expected errors by race configuration
- As a normalising device for comparing individual errors in races
- As a reference point for asking what the model doesn’t explain
It’s that last use which turns out to be the most immediate and most interesting.
Extending the Base Model and Evaluating Course Effects
We know from experience that not all courses present the same jumping challenge. A circuit at Worcester is not the same proposition as one at Aintree or Cheltenham.
If we are to build a fair jumping index at the horse level in future, we would want to account for the fact that an error-free round at Cheltenham may indicate a stronger jumping performance than the same at a minor track. This raises the question: should course be explicitly included in the model?
To assess this, we examined the residuals from our base model and how they varied by course. If some courses consistently show positive or negative residuals — i.e., actual errors exceeding or falling short of model expectations — that would indicate the model is systematically under- or over-predicting at certain tracks.
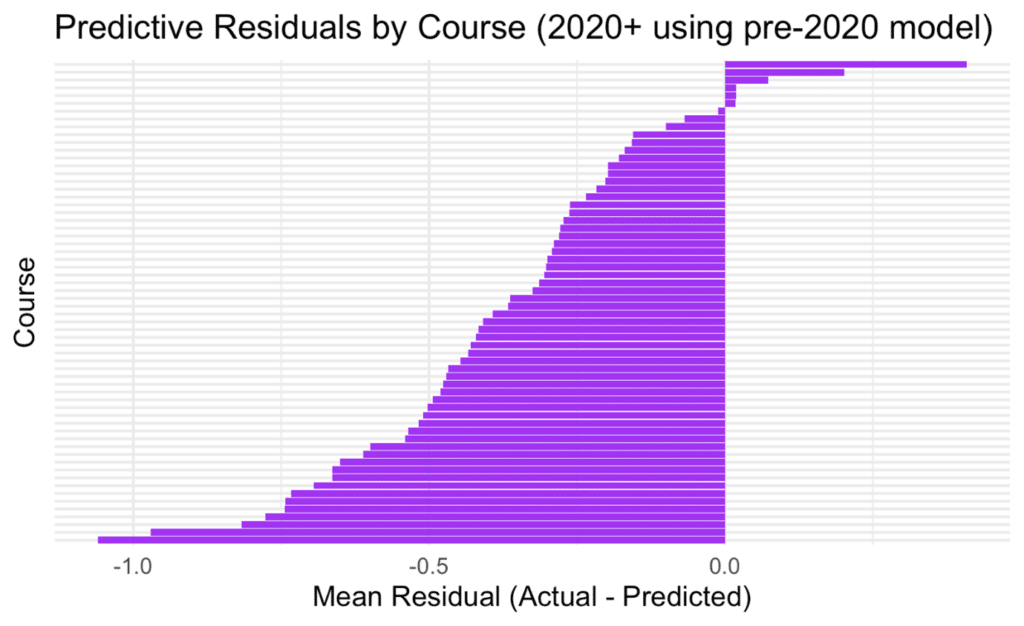
As shown, the vast majority of courses have negative residuals. That is, most courses are producing fewer serious jumping errors than the historical model would predict. The implication is clear: the landscape of jumping risk has shifted.
The bar with the most errors (what the model predicted in terms of major jumping errors versus actual) is the bottom one. Guess what? That’s Aintree! So the changes to the National fences have indeed had a material effect, and our model shows that. In fact, this value is over 1.0, which shows that there is just over 1 less serious mistake (where this is often a fall or unseat) per race than the model built on pre 2020 data expects. However, this isn’t an isolated picture – it applies across the board. The few exceptions (those with a small positive deviation from the model expectations) are all Irish courses, with the bar at the top being Naas.
So, across the board, it’s also true that there are far fewer major jumping errors per race post 2020 than pre. This means that our baseline model is also overestimating slightly, albeit that it is on average more accurate per course.
The course effect has therefore been ditched, and this suggests it’s really worth keeping an eye on very recent data when it comes to looking at course difficulty, and overall bearing in mind that jump racing is easier on the horse than it used to be.
What about the going?
Last but not least, what about the effect of going? It’s often assumed that a deterioration in going also leads to an increase in jumping errors. In this case, rather than adding to our model, let’s look at some descriptive statistics by taking a “middle slice” of the data and comparing fall rates across comparable samples, conditioned by going.
The below plot shows the results.
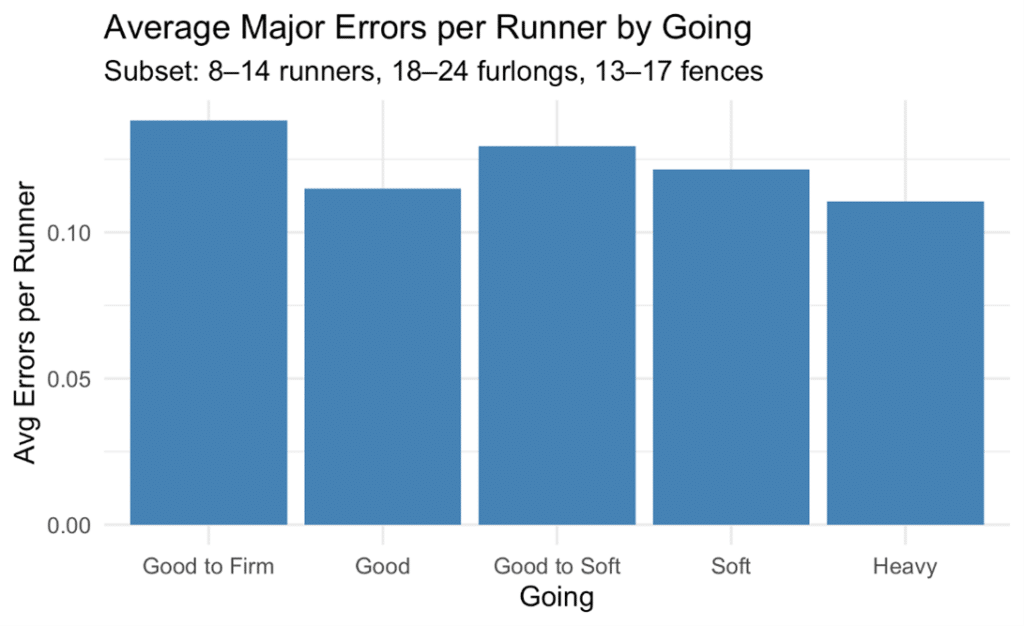
This time we switch to an average falls per runner basis, so normalising for the number of runners in each race analysed. Perhaps surprisingly, the “safest” going in terms of serious jumping incidents is on Heavy going, and the worst rate is on Good to Firm going.
A Theory: It’s All About Pace
My personal theory is that the going variations are all about pace and how fast jockeys and horses go off in any given race. Significant jumping errors don’t happen in complete isolation. They’re also a product of how fast a horse approaches the fence, how well it sees a stride, and how balanced it is on landing.
- On Good to Firm, horses travel faster, sometimes, it seems, too fast for accurate jumping.
- On Heavy going, jockeys often take a key decision to ride more conservatively, often at a snail’s pace! This slower tempo may well help horses meet fences correctly and under far less pace pressure, despite the tiring conditions.
- On softer ground, if the early fractions are misjudged, horses may be under pressure sooner without respect for the conditions, leading to fatigue-related errors mid-race.
- Good ground seems to suit horses and jockeys alike and lead to comparatively fewer errors.
Final Thoughts: A Changing Landscape for Jumping Analysis in Chases
What we’ve uncovered through this analysis is that jumping risk isn’t static, either across race conditions, courses, or time. While field size and fence count remain reliable indicators of the overall “exposure” to jumping mistakes, there are deeper dynamics at play. Course characteristics may still influence how a race unfolds, but their predictive power has changed dramatically in recent years, likely because of safety-driven course changes and a wider industry shift towards risk reduction.
Similarly, going descriptions don’t behave in line with simple assumptions. Errors aren’t just about surface condition, but how that condition interacts with pace, tactics, and decision-making, all of which are context-dependent.
For punters, the lesson is to treat jumping form as contextual, not absolute. The fact that a horse made a mistake at a particular course, or ran without making major mistakes on heavy ground, may mean something quite different today than it did a few years ago. It also raises a bigger point from a punting perspective. If the landscape of jumping risk has shifted, then our assumptions need to shift and adapt more rapidly too.
Colin Magee