Ayr – An In Depth Look
Just 37 miles from Glasgow sits Scotland’s premier racecourse, or so says the Ayr racecourse website, and who am I to argue with that? It also boasts free parking. That alone is a win these days!
Racing in Ayr dates back to 1576 but the first official meeting took place in 1771, although not at the same location as it sits today.
They hold both Flat and National Hunt meetings, holding the honour of running the Scottish Grand National in April and also the Scottish Gold Cup in September during the Flat season.
Flat races take place over 5 furlongs to 2 miles 1 furlong. National Hunt races, meanwhile, take place over anywhere from 2 miles to the aforementioned Scottish National which comes in at a shade over 4 miles. Conditions can get very gruelling (insert your own Scottish weather joke here!)
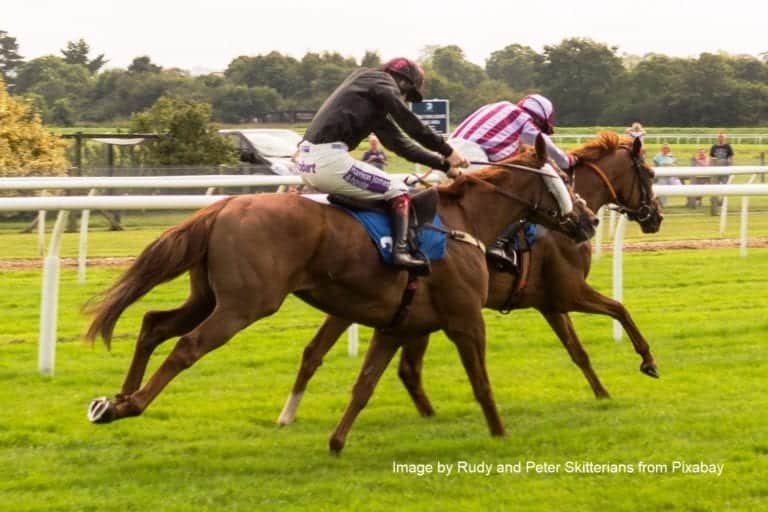
Let’s take a look at some overall stats. We’ll use the last three years, so effectively 35 months as November 2025 draws to a close at the time of writing. A look first at all types of Favourites. First up we’ll take a look at Flat Racing.
If you’d bet all favourites over our three year window, including joint and co favourites then you’d have made a small loss to Industry SP and a not too shabby 27 point profit at BSP prices.
Interestingly all the profit came from Joint Favourites with a very impressive 28% strike rate considering you’d have had two horses in each race, so effectively, you’d have got the winner in 56% of the races. However, most of that profit was in 2023. Let’s see how the National Hunt compares.
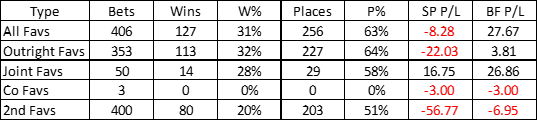
Much like the Flat, betting each and every favourite blind at BSP would have netted you a profit, albeit a tiny one. Again, it was Joint Favourites with the bulk of the profit and again it was 2023 where most if it came from.
Just to clarify, for everything following, it will continue to be from our data set of the (near) three year period of 2023 to 2025 inclusive.
As we’re in the middle of the season then let’s take a look at National Hunt first.

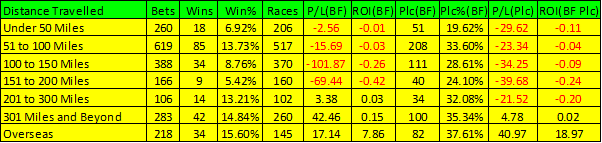
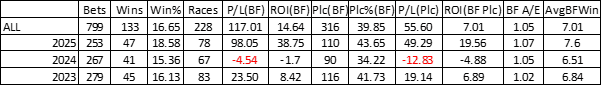
Above are the stats for all National Hunt races over the past three years. 236 races in all showing a BSP Loss of 128.58 had you bet every single horse.
It seems like the weather probably accounted for a few lost races during the 2024 season as the totals are probably two or three meetings light of 2023 and 2025. The consistent 11% strike rate suggests field sizes are pretty stable year to year.
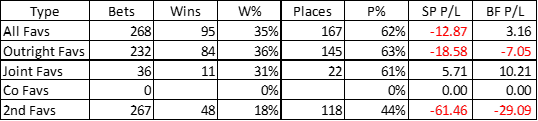
Going off on a slight tangent, what with it being one of the more remote courses let’s take a look at the miles travelled table and see whether those long trips are fruitful here or not.
Well, that’s a very intriguing table indeed.
Blanket betting any trainer who had travelled over 300 miles or come from overseas would have seen you almost 60 points ahead during our time frame. Place betting would also see a very impressive 45 points of profit.
Of course, there are plenty of losing trainers in amongst those distances travelled but it’s definitely an angle to pursue, I think.
Indeed, apart from one particular trainer in the 51 to 100 mile bracket, who we will doubtless come on to later and one in the 100 to 150 bracket and another bang on 300 miles, the totals for trainers travelling under 300 miles is looking very poor on the whole.
That really is quite a stark difference!
Let’s take a closer look now and see whether it is a consistent thing or whether we have a big winning year in our data giving us a nice looking overall profit or something a bit more evenly spread which would be very helpful.
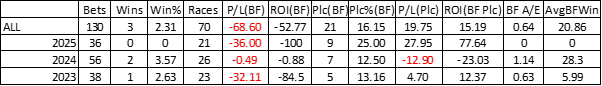
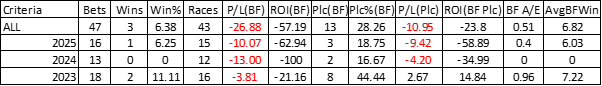
These are our totals with everyone that travelled 301 miles or more coupled with the three trainer exceptions.
Although a small loss you can see from the table above that this year is very much standing out in our data. That said, even an 8% ROI in 2023 is not to be sniffed at for less than a bet a day over a year. However, in terms of just a blanket approach then as was to be expected it would be very erratic.
For the record the longest losing run was 32, although the second highest was just 18. To further highlight the erratic nature, at BSP the highest winning day would have seen us bank 52.64 points whilst the worst losing day would see a loss of 17.03 points.
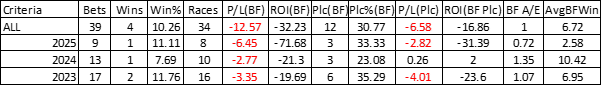
One area that I would certainly consider as a filter here is the forecast odds. If we look at the table below this is for all horses that had a forecast price of 17 to 101.
My thinking here and why I would consider it as a filter is that these horses are travelling a long way and are unfancied. Now, unless the trainer knows something the Handicapper doesn’t, it would seem to me that they are largely along for the ride with a more fancied horse from the same stable.
Another key point is that two of the three wins come from our excluded trainers.
Removing those leaves us with this table.
In keeping with that they are travelling a fair distance let’s look at their record in their last three races and see whether having a bit of decent form is an important factor here. I would imagine it would be but let’s see.
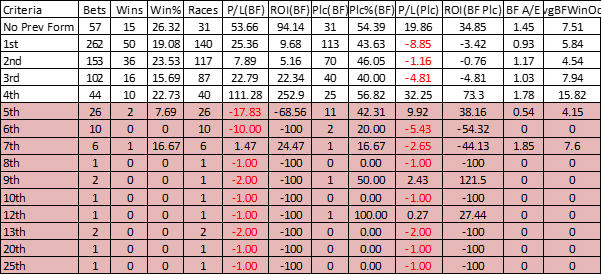
Any horse that hasn’t had at least a fourth placed finish (or is yet to run) has mustered just three wins from fifty one outings for a loss of 35.36 points compared to over 200 points of profit for the rest.
In keeping with coming into the race with a bit of form this is the record of those who either fell or were pulled up last time out and it doesn’t make good reading. It does, however, in terms of a filter.
Likewise, here’s the record of all those who did finish their last race but trailed by at least 30 lengths or more.
National Hunt Flat races show a pretty big loss and a low A/E which is at odds with just about everything else that has a decent number of bets, so we’ll remove those as well.

We’ll leave it here.
There are other possible areas to look at such as trainers in our data who have yet to win, for example Nicky Henderson is 0 for 7, and also female horses have a comparable strike rate but account for very little of the profit.
I’ll leave those for those who wish to dig a little further in. For now, we’ll take it as it is and I am going to test it to small stakes over the next year.
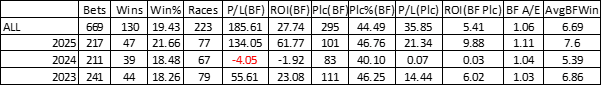
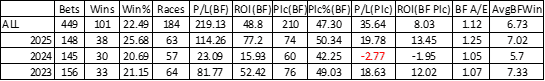
This is how our final table looks.
Our lowest win profit has been 23 points with an ROI of 15.93%. Each year has mustered at least 30 wins from around 150 bets.
Weather permitting there are a couple of meetings to go this year that could bring around another 20-30 bets based on 2023’s qualifiers. 2024 had no qualifiers in December (presumably the meetings were victims of the weather).

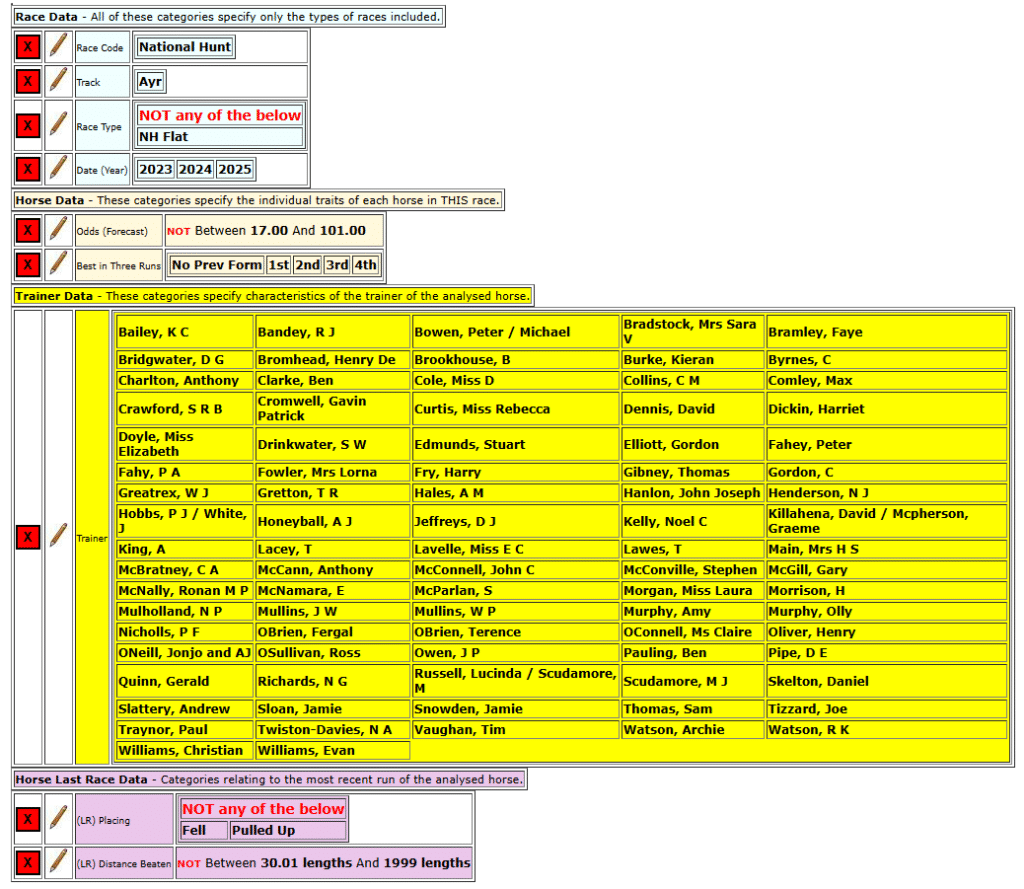
The three trainer exceptions who were in the under 301 mile traveller group, should you wish to investigate further, are Lucinda Russell, Nicky Richards and Dan Skelton.
|
The rest of this article is for Platinum members. You've just seen what our experts do with publicly available data — the Platinum section is where the specific angles, numbers and actionable conclusions live. Platinum members also get daily system selections in their inbox by 2am, tips from top tipsters, Win Big Golf selections, and access to 11 years of magazine archives. |