
Racing to Profit
In this article I thought I would do something different from what I usually do when it comes to researching trainer stats & pointers. I usually look for positive angles. Today I thought I’d focus on ‘negative’ or ‘could do better’ trainer traits, which may help when deciding whether or not to oppose them. Given we are in November, I’ve focussed on jumps trainers. I hope you find the following of some use…
All stats go back to the start of 2015 through to October 2020, and just focus on handicaps.
Fitness
Many trainers consciously decide to leave plenty to work on at home, using a run or two at the track to build up race fitness. Sometimes this is strategy, facilities or indeed the quality/ability of work riders. Or the trainer may simply not be very good at getting a horse fit at home.
Obviously if a horse has won after a break for today’s trainer, you can have more confidence than usual about fitness. I like to look at a trainer’s record with horses that have had 0 runs in the previous 90 days.
The overall win strike rate for such types, in all jumps handicaps, is 8.31%. 19.5% of races are won by horses with no run in the previous 90 days, where such runners exist.
Knowing those trainers that have, up until now, generally failed to get horses fit enough at home, can be useful. Or certainly where said runners may require much closer scrutiny.
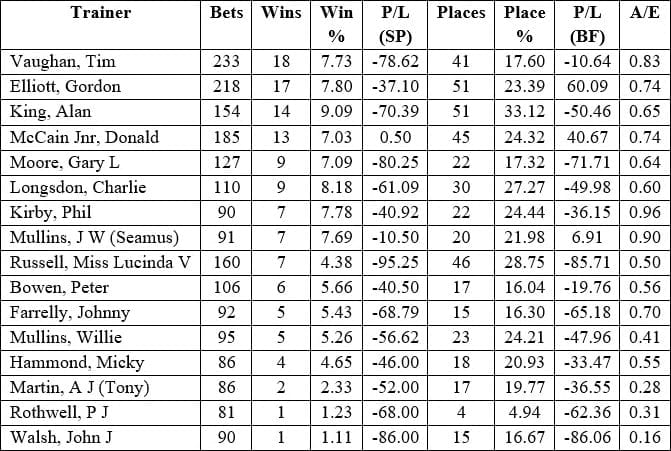
Below you can find a selection of yards where it can be hard to home in on those who are fit enough. Of those with at least 75 runners in the period…
Handicap Hurdles
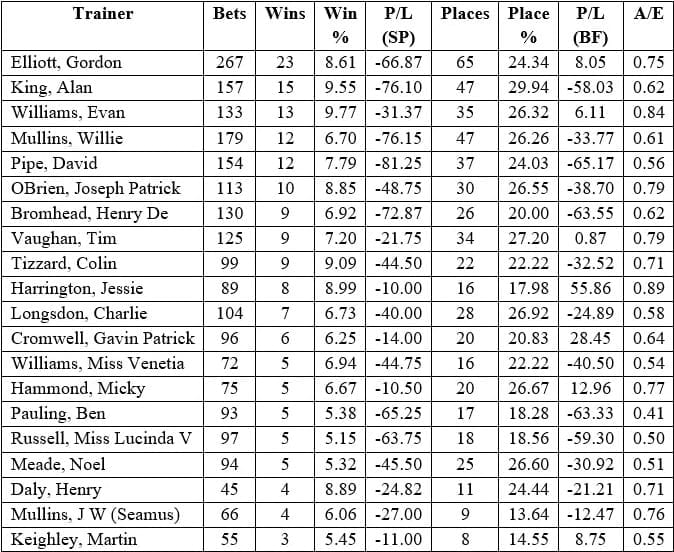
Handicap Chases

Some of those names above, especially with the chasers, can clearly ready them, and they will have horses that are best fresh – it’s just a question of picking them, which is easier said than done.
They all perform way below market expectations and backing such runners regularly will only lead to a diminished betting bank in time.
Of course, if fancying one on their first start in 90 days, it may be a case of wanting a bigger price. Of course, the other way to use such data is to be more forgiving of a horse ran on their return after a break, and whether they travelled well to a point before blowing up.
Handicap Debut
Another profile of horse where it can pay to know both a trainer’s positive and negative record is with handicap debutants, especially over timber. Handicap hurdle debutants win at a 7.8% strike rate against the number of bets, winning 16.63% of races where a handicap hurdle debutant is present.
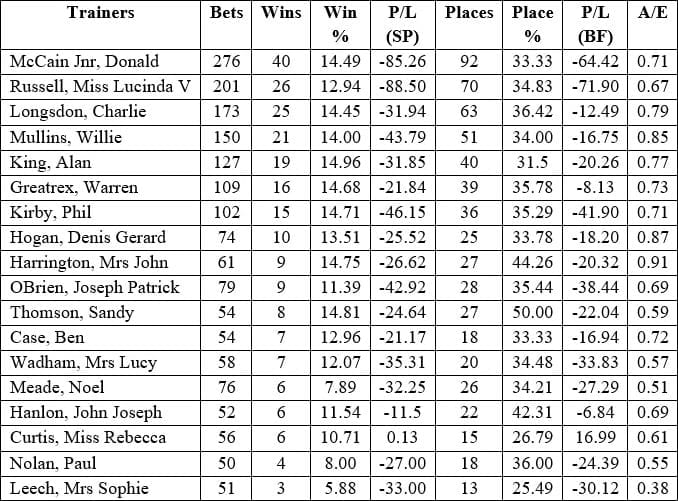
Below is a selection of trainers who could arguably do better with such runners, maybe deciding to take a more patient approach with many. For some it may be a case of targeting certain tracks with such runners, but it can be hard to land on the right ones and in some cases maybe the market is the best guide of what is expected…
Last Time Out Winners
Finally, I thought I would look at those trainers who ‘could do better’ with LTO winners and getting them to follow up. LTO winners win 18% of the time and 30% of races where there is at least one LTO winner running.
These stats are for all National Hunt handicap runners (both chases and hurdles). I’ve stuck to those with at least 50 such runners since the start of 2015 and with a win strike rate below 15%. Again, you can see how over-bet they are, performing markedly below market expectations. Anyway, such stats may be of some use in your puzzle solving deliberations…
Happy punting, Joshhttps://racingtoprofit.co.uk/FREE REPORT… if you’d like a free report from me, looking at pace/race position in handicap chases, CLICK HERE>>>