Draw Stats for The Flat Season
The flat season is now in full swing so now seems a good time to share some of my recent draw research. As some of you will know I started off back in the 90s writing books on the draw, so it is an area I have always had a major interest in. During the winter I updated my draw stats, as draw biases can change and it is important to keep on top of these changes when they occur. Spotting such changes before bookmakers and other punters can give you a useful edge.
This article is part of our Complete Draw Bias Guide — covering every UK course and distance in one place.
At this juncture it should be noted that draw bias is not as prevalent as it was twenty to thirty years ago. Hence the edge draw punters had ‘back in the day’ has diminished considerably. However, there are still enough draw biases in play to give shrewd punters an edge. It is important, if possible, to understand a) how strong the biases are and b) whether the betting market has compensated, or possibly over compensated.
In this article I am going to split into quarters (quartiles). For those of you interested in this type of ‘draw splitting’ the excellent horse racing website www.horseracebase.com has the capacity to do this in its system builder. The data I am sharing in this piece is relatively ‘raw’ – essentially it gives readers a starting point from which they can explore further. I will add a few additional stats though where appropriate.
I am analysing draw data from the last six full seasons (covering 2018 to 2023) concentrating on handicap races with 8 or more runners. I use handicaps only when studying the draw as these races tend to be the most competitive, as well as there are a decent number of handicaps over a year. In addition, I believe the number of runners is important too when it comes to the studying the effects of the draw.
Eight runners have always been my minimum – races with smaller fields lack validity in my opinion when it comes to draw bias analysis. My focus is on turf courses so there is not any all-weather course data shared in this piece. I will be looking at the two shortest race distances namely 5 and 6 furlongs.
5-Furlong Handicaps
Firstly, let me look at all courses in the UK that have had at least 25 5f handicap races with 8 or more runners over the period of study.
The table will show the win percentages for each quartile of the draw. You would expect the percentages to be around the 25% mark if there is no potential draw bias in play. Clearly the further away the percentage is from 25 (above or below that mark), the more likely a draw bias exists. It should be noted that the results for the two Bath 5-furlong trips have been combined:
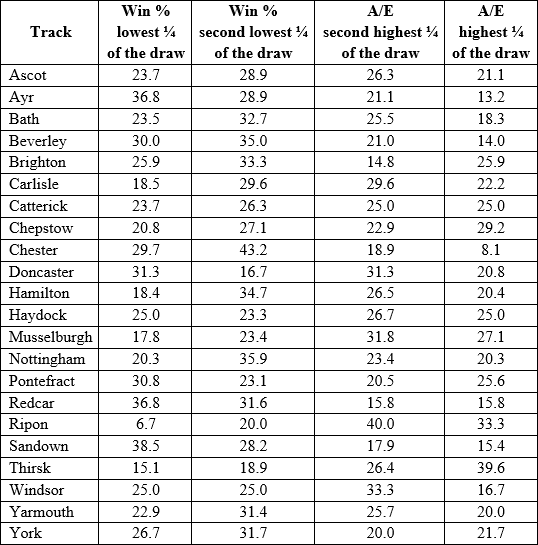
We have some interesting findings here – let me go from top to bottom of the table starting with the figures for Ayr.
They show a definite bias to lower draws with the lowest quartile winning nearly three times as often as the highest quartile. High draws have been very poor value over this period of study at the Scottish track.
Beverley shows a similar edge with the bottom half of the draw comfortably outperforming the top half. However, the draw bias here is well known and despite low draws having this edge the market is fully aware of this.
As a result, it can be hard to get value on many of the lower drawn runners. Also, it should be understood that the bias at Beverley is less strong now that it was back in the late 90s / early 2000s.
Another bias that has been around for many decades is the Chester bias. The very tight nature of the track has always favoured lower draws, although these recent figures suggest that the second lowest quartile is the best place to be.
Very high draws have always struggled and as you can see, that is still the case.
Redcar is another course that has been seeing a strong bias to lower draws. Indeed, horses drawn 1 or 2 have a particularly strong record – they have excellent ‘numbers’ when it comes to their Percentage of Runners Beaten (PRB) figures.
0.50 is the mean average for all runners but draw 1 at Redcar hits 0.63 and draw 2 hits 0.64. Compare this with horses drawn 10 or higher in 5f handicaps at Redcar whose PRB figure averages out at 0.42.
The good news is that lower draws should still offer some value this year as the market has not yet fully caught up.
Ripon has seen the top half of the draw dominate with very low draws struggling. The ground next to the near rail seems to have been riding a bit quicker recently.
You would have made a blind profit to SP backing all double figure draws at Ripon over the past six seasons.
Sandown seems to have an edge to lower draws too, while high draws at Thirsk definitely look best.
Thirsk always used to have a very strong high draw bias, but it had tailed off a little between 2012 and 2017, but it seems to have reemerged again for whatever reason.
This is a Gold member article, if you are a Gold or Platinum member you can read the whole article here or you can upgrade your account here.