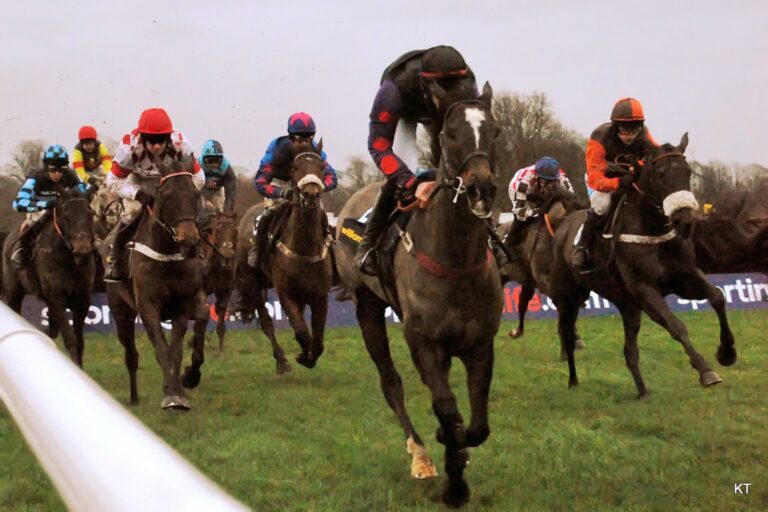
Chepstow
This month we venture into Wales. Having started last month with Ayr, home of the Scottish National, it seemed a good idea to move onto Chepstow, the home of the Welsh National next. Chepstow is another dual code course with plenty of racing on the Flat as well.
The course itself is in the Wye Valley in Monmouthshire in South East Wales. It is a left-handed oval course with many undulations and is known for providing a true test of stamina.
Flat races are run from 5f to 2m 2f. Everything up to and including a mile is run on the straight where there is an extended piece from the oval.
The emphasis is very much on stamina due to all the undulations in the ground.
National Hunt races range from 2 miles up to the 3 miles 6½ furlongs of the Welsh National and beyond.
The Welsh National is a race with 23 jumps and with it being run on the 27th December it is often run in tough conditions making it even more of a test. For example, the 2023 edition run in soft conditions saw just 5 of the 19 runners complete the race with every one of those 14 jockeys pulling up their horses.
A look at the last five years of National Hunt races here shows us that there are over 100 races held each year and race numbers seem pretty consistent judging from the win%, suggesting around 9-10 runners being the average field size.

If we look at trainers there are 16 trainers who have saddled more than ten winners over the past five seasons at Chepstow. Paul Nicholls is some way out in front with 50 winners at a 21.19% strike rate but also a healthy loss if you were to bet all his runners. Sam Thomas has the most winners (19) of those who show a profit across all their runners. He is 25.99 points up in this five year period.
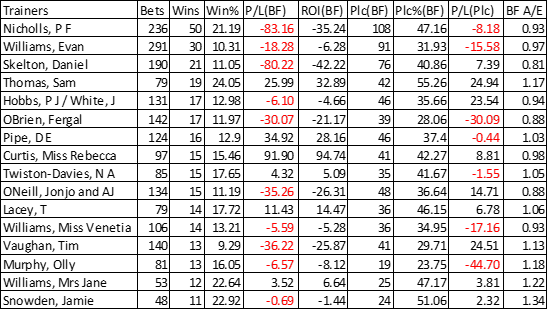
Broken down into NH race types we see that Sam Thomas tops the Chase table and this would appear to be where his profit has come from. Jamie Snowden also has a very good record here albeit with a small number of runners.

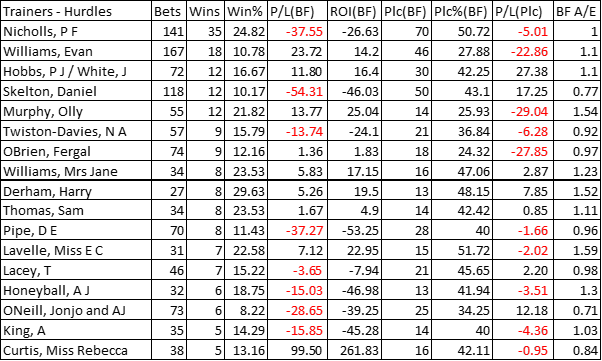
Turning our attention to Hurdles and Paul Nicholls is well out in front in terms of wins but his losses remain high if you were to bet them all.
Finally for Trainers, here’s how the NH Flat races have fared.
Paul Nicholls again way out in front and this time more or less breakeven over his 36 runners and 12 wins.

A look at race types now.
It’s interesting to see Handicap Hurdles actually show a tiny profit across 135 races which suggests there’s a big win or two in there somewhere.

After the fact and cherry picked but had you bet every horse that went off between 14.01 and 65.00 BSP in a Handicap Hurdle race at Chepstow over the past five years then you’d have been over 200 points in profit!
What’s more intriguing is that three of the five years were profitable and the two losing years were both only around 5 points down.
The longest losing run was 51.
However, there were on average 4-5 qualifiers per race suggesting that would be 10-13 races without a winner.
Either way not for the faint hearted! Food for thought though.

Just glancing at the qualifiers shows that it picked up King of the Lake at 20.88 who just won on the 27th December; one of 8 would be qualifiers on the day across two races. The previous winner came on the 11th October, a 20.34 BSP Winner.
This was actually only 7 betting races apart but I’m not sure if the time between races would make it more or less stressful!
Also of course having to base it off BSP means without automating it then you’d need to be watching every race just before the off which is impractical.
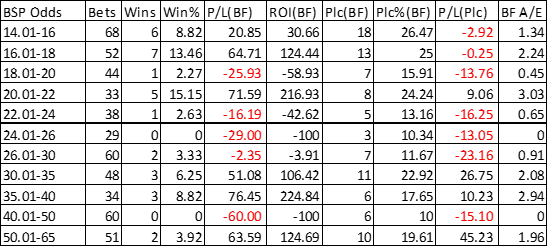
An option to make it a qualifying bet and just put it on and not have to monitor the odds would be using the Forecast Odds.
Looking at these for our qualifiers above it seems that most of the winners came when the horses’ forecast odds were between 13 and 26 inclusive. Of course, that would then pick up horses that went on to have lower BSP odds than our 14 cut off and also those who went out beyond the 65 BSP as well.
However, I am curious about it so let’s take a look out of interest.
To recap, this table below is Handicap Hurdles races at Chepstow over the past five years where the horse had forecast odds of between 13 and 26 (12/1 – 25/1) inclusive.
And it makes for very interesting reading!

Each year is in profit and the strike rate is pretty consistent, about one in 13-16 races. Longest losing run stands at 41.
As a bonus compared to our BSP based table we would also have picked up Another Fine Mess on the 27th December at BSP odds of 12.50. Our BSP odds vary quite widely.
Those over the cap of 65 BSP from our original range also produced no wins from 75 of them in total during our five year window. If you were to remove those then the longest losing run comes down to 33.
Strike rate goes to 8.78% and Profit to 268.17 points.
It is something that could be automated of course although it also might just drop in a winner every few years that more than covers those losses.
Food for thought again anyway!
|
The rest of this article is for Platinum members. You've just seen what our experts do with publicly available data — the Platinum section is where the specific angles, numbers and actionable conclusions live. Platinum members also get daily system selections in their inbox by 2am, tips from top tipsters, Win Big Golf selections, and access to 11 years of magazine archives. |