Draw Bias – Getting Ready for the Flat
My latest draw bias research (turf and all weather)
The flat season starts in roughly a month’s time and this article looks at some of the draw bias research I have done over the winter. It is important to not leave your research to the last minute, as one wants to be fully primed, with no distractions once the turf season starts. Also, at the end of the article I have highlighted some all weather draw biases that you should be able to utilise while you wait those few weeks for the turf season to kick in.
This article is part of our Complete Draw Bias Guide — covering every UK course and distance in one place.
I have studied and written about draw bias in flat racing for 25 years now. I’ve written four books as well as numerous articles. Draw betting in late 90s and early 2000s provided me with a good source of winning bets. However, the draw and draw bias has had massive exposure in the last few years, and in truth the value has started to disappear. This is very much a horse racing trait – good ideas gain an initial edge because most punters are unaware of that “winner finding” approach. As time goes on though, the betting public and the bookmakers start to catch up, and as a result the prices tend to contract and the previous edge begins to disappear. This has happened to some extent with the draw, but to confound the problem course officials started using other means of negating potential draw bias.
Running rails are moved in order to keep horses off the fastest strip of ground, and better watering systems mean that watering is far more even than it was then.
However, it is important not to write off the draw completely as I still believe there is an “edge” for the educated “draw punter”. I maintain that at certain tracks a poor draw can still all but wipe out the chance of a horse, while a good draw increases one’s chances considerably.
My draw research have always focused on handicap races only. My belief is that handicap races give a more robust data set as the ‘idea’ of a handicap is to give all the runners an equal chance of winning. Of course this does not happen but most handicaps are pretty competitive with several horses having a chance of winning. When analysing each handicap race, I divide the draw into three – those drawn in the bottom third (low), those drawn in the middle third, and those drawn in the top third. It should also be noted that I also adjust the draw positions when there are non runners – for example if the horse drawn 1 is a non runner, then the horse drawn 2 becomes drawn 1, draw 3 becomes 2 etc. On a completely fair course the winning percentages for each “third” of the draw should be around 33% each. The differences in the percentages will naturally help us to determine the strength of any bias.
As a rule there are two types of draw bias; firstly a bias towards one specific third of the draw – this is the strongest possible bias. Secondly, you can get a bias against one specific third of the draw.
Field size is also important – for potential draw bias to exist I believe there needs to be a reasonable amount of runners in the race. I therefore focus on races with 8 or more runners. Draw bias is far more likely to be prevalent in larger fields as horses will either be forced to run wide (hence having further to travel), or be forced to run on a part of the track where the ground may be slightly slower.
For this article I have looked at handicap data from the last 5 seasons (2017 to 2021) with the focus on UK course and distances.
There is not scope in one article to discuss every single draw bias I have unearthed in my latest research, but I do hope there will be enough to be going on with.
Ayr 5f – Draw Bias
Up to Scotland first.Here are the draw splits for the minimum distance at Ayr:
Here is a good example of bias against a particular section of the draw. High drawn runners have really struggled in the last 5 seasons. Indeed, horses drawn 10 or higher have provided just 2 winners from 77 runners. If you had placed a £1 bet on all these horses at SP you would have lost £61.00 which is equivalent to losing 79 pence for every £ bet!
Finally draw 2 seems to have been ‘lucky’ with 9 wins from 31 runners.
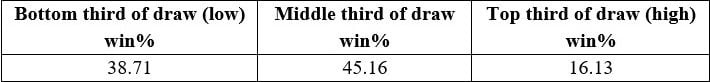
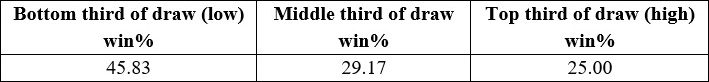
Beverley 5f – Draw Bias
In the late 90s one of the strongest draw biases was at Beverley over 5f. Horses drawn next to the rail always seemed to have a huge edge. This edge is much diminished these days, but those drawn near the rail (low) do still have an edge as the stats below show:
It is arguably not a playable bias on a regular basis, but you may find the odd decent betting opportunity. As the field size increases the bias to low draws increases a little it seems. In races of 11 or more runners the low win% increases to 46.7% while the high draw win% decreases slightly to 22.2%. How significant this is in reality, is hard to say.
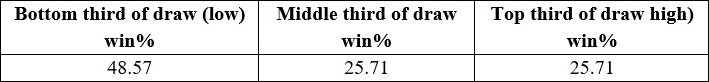
Brighton 1m – Draw Bias
Brighton used to my local track (along with Goodwood) so I know the course and its quirks pretty well. There have been 60 qualifying races at this C & D in the past 5 seasons and very low draws have definitely struggled:
The placed stats are also quite poor for low drawn runners so there definitely seems to have been a draw bias against them. It is also worth noting that the lowest drawn stall has produced just 1 winner from 60 runners.
Chester 7f and 7½f
There are two 7 furlong trips at Chester, the longer trip being around 120 yards further. Chester has long been renowned as a draw biased course due to the tight nature of the track. The low drawn bias seems to have been very solid over these 7f trips in the past 5 seasons. Here are the combined 7f stats:
It is worth sharing with you that the lowest three stalls have provided 33 of the 70 winners. To put this in context, these draws have provided 47% of the total winners from 28% of the total runners. Pretty impressive.
Chester 5 and 6f results are equally strong in terms of the low draw bias, although due to recent rail movements the bias may not be quite as potent as it once was.
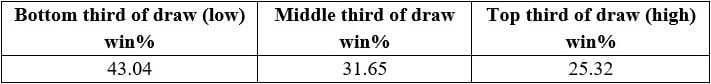
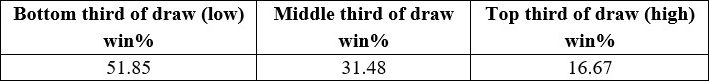
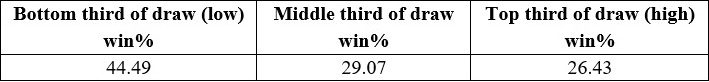
Goodwood 7f
This is another traditional draw biased C & D where the inside rail (low) has for years been the place to be. Like Beverley’s 5f bias, it is less strong these days, but you would still prefer to be drawn lower than higher as these stats show:
As the field size increases the bias starts to strengthen – races with 11 or more runners have seen 13 wins from 25 races (52%) for the bottom third of the draw. I think over the years, this 7f trip has provided me the most value from any draw
Goodwood 1m
An extra furlong makes little difference to the bias as once again lower draws have had decent success. The only issue with this distance is that qualifying races are quite rare (just 20 in the past 5 seasons. 11 of the 20 winners have come from the lowest third (55%).
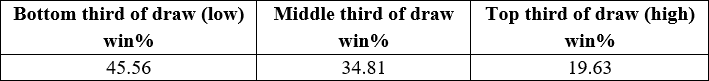
Pontefract 1m
This has been a consistently draw biased distance at Pontefract for some time now. Arguably between 2009 and 2016 the bias was even stronger, but draw fans have a C&D to still get stuck into:
23 of the 54 winners were drawn in one of the two lowest stalls. Hence over 42% of all the winners came from these two draw positions – essentially they have won 2.5 times more than they statistically should.
Onto the strongest all weather draw biases now starting with two at the same course.
Kempton 6f
first up Kempton. Those horses drawn next to the rail (over 6) definitely have the edge:
Not only do lower drawn runners have the edge, it is tricky to win from a high draw. The very highest draws (11 and 12) have really struggled providing just 6 winners from 172 runners.
Kempton 7f
Low draws have the edge over this extra furlong also, but the bias is less potent than it is over 6:
What is worth pointing out is that the lowest two draws have been 2.37 times more likely to win than horses drawn 9 or higher (max filed size 14).
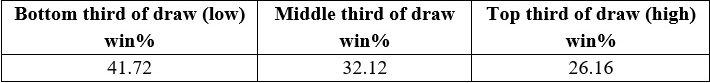
Chelmsford 1m
The 1 mile trip at Chelmsford starts from a chute and this is probably the reason lower draws are favoured over this trip:
There seems to be some value to be had with the lower drawn runners and given the choice you would rather your selection was drawn low.
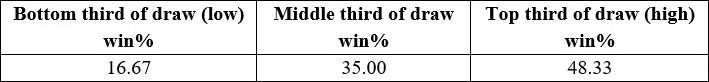
Newcastle 5f to 1m
The straight course at Newcastle accommodates four separate distances. 5f, 6f, 7f and 1 mile. Here are their combined draw stats:
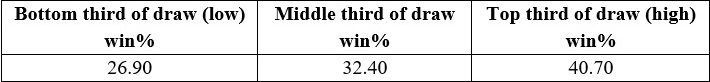
A small but tangible edge for higher drawn horses, and higher drawn horses have a remarkably similar advantage at each of the four distances. As noted it is not a very strong bias, but ultimately when backing at Newcastle on the straight course, the better value runners are almost certainly going to be drawn higher. Indeed when the field size reaches its maximum (14) the top third of the draw have accounted for 44% of the winners (176 races in total).
I hope you can see that draw bias is alive and well, albeit not quite to the level of the late 90s. AND we can utilise the draw all the year round thanks to all weather biases shown above.
Also read Matt Bisogno’s Pace Wins the Race and our 1st and 2nd Favourite Winning Systems