
How much merit do certain types of trainer stats have?
I am guessing that a decent proportion of you reading this article use trainers in some form or other when betting on horse racing. It may not be a key factor for every bet, but it is certainly something many consider. There will be others of you who I imagine that make regular bets derived from specific trainer stat or stats.
Why is this I wonder?
Well trainer stats are everywhere we look when it comes to betting newspapers, websites, etc. You can easily find trainer course stats, trainer / jockey combination stats, recent trainer form stats (last 7, 14, 30 days), etc.
So clearly that is one reason.
Another reason is the ‘human’ factor. Just like some punters have favourite jockeys, some punters have favourite trainers and hence some of their bets can be biased to towards them. Another reason is that most trainers have plenty of runners over a period of time and hence big data sets are created.
Generally speaking, the more data we have, the more confidence we have in the figures it produces. Also the more data we have, the more we can break it down into smaller data sets.
What I mean by that is that if let’s say a trainer has had 150 runners at a specific course in the past ‘x’ number of years, this data could be broken down into different race types, or distances, or starting price groupings, etc. Breaking this data down into smaller subsets provides the potential to find more profitable angles from the past.
I must admit I do have a slight issue with using certain trainer data due to the significant amount of trainer stats I have studied and ‘crunched’ over the years. I have found many profitable trainer angles looking at past data, but only a relatively small proportion of these findings have proved profitable in a future period.
One area I have found where trainer stats have tended to be more consistent is trainer data from specific courses. Trainers do tend to have their ‘preferred’ courses it seems, mainly I guess due to geographical reasons.
In this article I am going look at National Hunt trainer stats over two time frames – my plan is to collate trainer data from 2010 to 2015 and then compare it to 2016 to 2021 (actually to the end of November 2021 when I wrote this piece).
I will use trainer course stats for the reason discussed in the previous paragraph to do this. Now some punters swear by trainer course stats so let us see if they are right to do so.
In order to choose the stats to compare firstly I needed to decide on some courses to look at. I simply chose the first 20 UK courses in the alphabet – so Aintree through to Kempton.
Then for a trainer to ‘qualify’ as it were, I decided that from 2010 to 2015 they needed to have secured a strike rate of at least 18%, made a profit to Betfair SP and also had an A/E value of at least 1.00. In addition, they must have had at least 50 runners to give the ‘sample’ some credibility.
This gave me 35 trainer / course combinations that matched my criteria. Their results are shown in the table below.
I have ordered the results by course (profits calculated to £1 level stakes using Betfair SP):
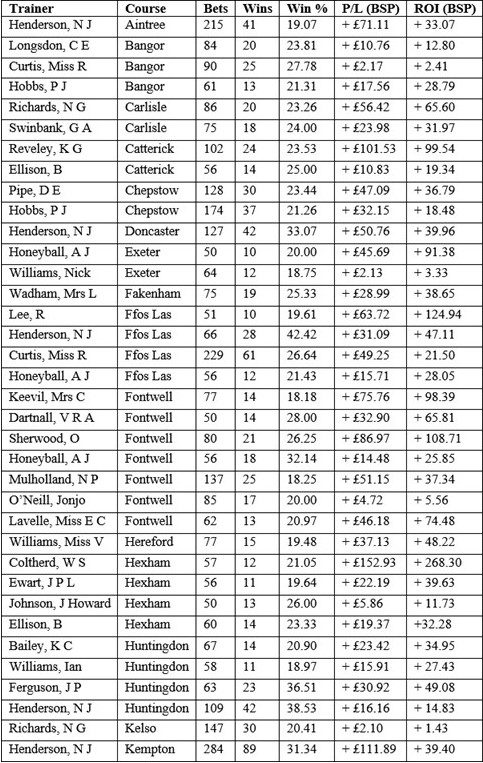
If you had bet all these trainer / course selections from 2010 to 2015 you would have secured a profit of £1410 to £1 level stakes to BSP. So at £10 per bet that would have equated to just over £14,000 returned. I think many of us would settle for those kind of returns!
However, now for the acid test. How did these trainers perform in the subsequent time period from 2016 to 2021? Did they make a decent profit again once combined as a group? How many individual trainers made a profit this time around? Here are the results:
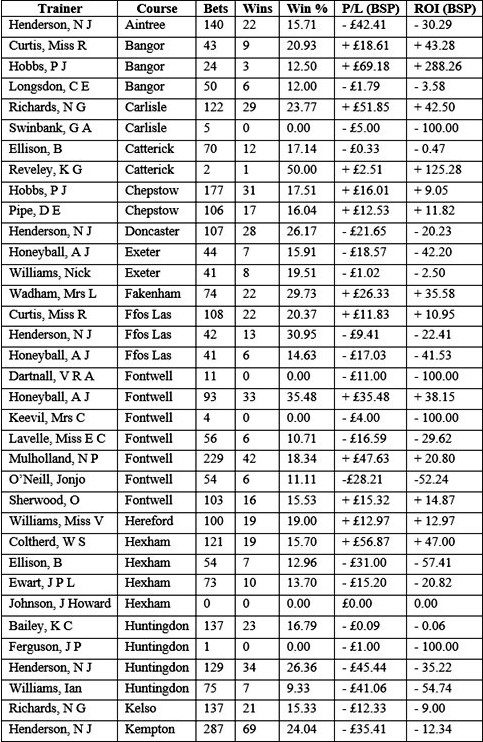
Now some trainers in the original list have since retired which explains some of the small samples. However, 28 of the trainer / course combinations have seen at least 40 runners which gives us a good comparison with the original data.
Overall, 13 trainers made a profit from 2016 to 2021, with 21 making losses, while one trainer had no runners at all. When we analyse all the figures, the trainers did combine to make a profit to BSP, but not quite the £1410 amount we saw in 2010 to 2015 – they combined to make a small profit of £18.58 to £1 level stakes.
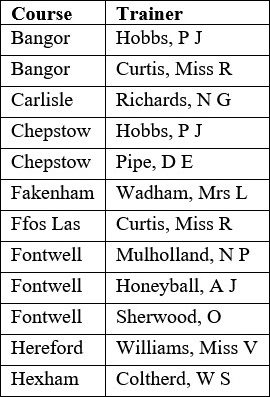
So where does this leave us in terms of the trainer stats debate? The first thing to say is that we have only looked at course trainer stats, and not all courses have been looked into. Having said that, 20 courses is a decent sample – roughly half of the UK National Hunt courses. What is clear is that profitable angles from the past may not be replicated in the future. This is something I mention a lot in articles; past results can be a good indicator of future results but there are no guarantees. It will be interesting to see how the trainer / course combinations that made a profit in both time frames perform in the next two or three seasons. Hence, it is worth keeping an eye on the following:
It will be worth taking a look at the other courses in the UK and continue this experiment, and I definitely will crunch the numbers at some point. My guess is that we will see a similar big drop off in the results of the second data set.
This article has made me keen to revisit other trainer based angles with a view to comparing results from two time frames. If any reader out there has a trainer angle you would like me to look at then please get in touch and I’ll see what I can do.
David Renham
Featured Image: Trainers watching Many Clouds enter the parade ring. – (CC BY-SA 4.0)