Market bias in 5f handicaps
In this article I am looking to see whether market forces are the same at different course and distances. I did some research into this way back in 2009 and it proved very valuable.
The races I am going to focus on are 5 furlong turf handicaps and I have concentrated on races with 9 or more runners.
To investigate this market forces idea as thoroughly as I can, I have decided to use two different approaches.
Method 1 is the simplest and hence the quickest – splitting the betting market into three thirds – this is exactly what I do when I analyse draw or pace bias.
Method 2 was to use the number of runners in comparison to the prices on offer – I will explain how this method works later on.
I was hoping that the two methods would produce very similar results – let us see.
The data has been taken from the last 10 full seasons (2012 to 2021) and let us first look at the “thirds” method (method 1).
Method 1 – “spitting market positions into thirds”
– the idea here is fairly straight-forward.
Horses with the shortest prices will be classified in the top third of the market, more mid-range prices will be classified in the middle third of the market, while bigger prices/outsiders will be classified in the bottom third of the market.
I have used Betfair SP rather than industry SP to do this. The reason being with industry SP you do get a few prices that are exactly the same. That can make the splits into thirds tricky.
One slight downfall of this method is that there is not always an even split due to the actual number of runners, but it should balance out as the table below shows:
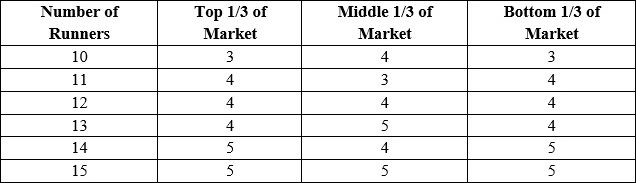
Hence, with 10 or 13 runners, the middle ‘third’ gets the extra runner, while races with 11 or 14 runners the top and bottom ‘thirds’ get the extra runner.
This idea continues for all other groups of three.
The maximum field size for any race was 24 where each section had 8 runners.
Hopefully therefore, we will get a fairly accurate reflection of market bias overall.
For all 5f courses the handicap market bias stats for winning horses are as follows:
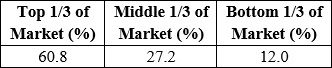
No surprises that the top end of the market has produced the majority of winners – essentially the top ‘third’ of the market have produced the winner 4.6 times more often than the bottom ‘third’ of the market.
Let us now break down these stats by course.
There is quite a variance between courses – I have ordered them initially alphabetically:
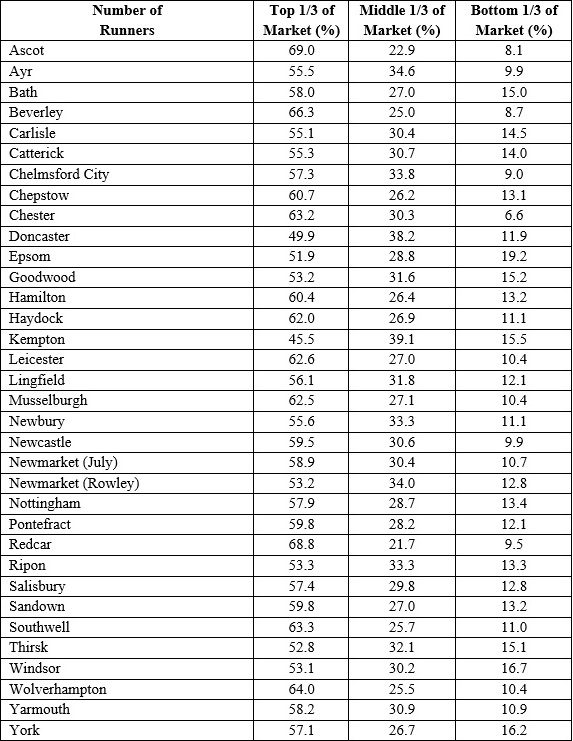
Ascot tops the list for the top ‘third’ of the market with 75.9% followed by Chester on 71.4% and Redcar on 70.4%; it will perhaps come as no surprise therefore to hear that these three courses have served favourites well in the last 10 seasons.
All three have made a blind profit to Betfair Starting Price with Ascot’s figures particularly impressive.
Clear favs at Ascot have produced 16 wins from 47 (SR 34.0%) for a profit of £33.09 (ROI +70.4%).
Kempton Park has the lowest figure on 42.1% while Doncaster is next ‘worst’ on 46.6%. So, there is a huge difference between some of the courses.
A question that needs to be addressed at this juncture is how valid are these course figures?
To read the rest of this article upgrade to a Gold account now by clicking HERE
David Renham
Featured Image: Image by jocelynping321 on Pixabay