
Modelling the Relationship Between SP, BSP and Beyond. A practical investigation using UK & Irish racing data
Most bettors understand that the bookmaker Starting Price (SP) and the Betfair Starting Price (BSP) do not behave in the same way. Both are generated from the same race but from very different market mechanisms. SP reflects margin, trading between firms, liability management, and long-established conventions in odds-setting. BSP reflects the aggregated judgement of thousands of backers and layers interacting in an open exchange environment in the final minutes before the off.
Because of this, the two prices often diverge — especially in the tails of the market, where SP can be heavily compressed and BSP can drift to levels that would never appear in a traditional fixed-odds book. Analysts are generally aware of this skew; what is less clear is how to reliably reconstruct it from SP alone.
In practice, most attempts fall back on simple “fair odds” treatments: remove the overround proportionally; remove it more cleverly using power methods; compare the result to BSP and accept the mismatch. These approaches are all useful to some extent, but they implicitly assume that SP and BSP differ only by margin, not by structure. With nearly two decades of data of BSP and SP data from Smartform to hand, we can go further.
The aim of this study is not to declare a new universal formula, nor to claim that BSP is a perfect arbiter of “true prices”.
Rather, the goal is to measure — carefully, transparently, and across a large dataset — how SP typically transforms when it crosses over into the exchange environment, and whether a simple structural model can reproduce that transformation better than standard fair-odds techniques. We will also look at how and why this is a useful endeavour when it comes to the practise of betting.
Data and Setup
The dataset covers UK and Irish flat and jumps racing from 2009 onwards, including:
- Industry SP
- Industry forecast price (FC)
- Betfair Starting Price (BSP)
- Field size, meeting, finishing position, and other race metadata
All data is imported from Smartform.
Models are trained up to 31 October 2024 and evaluated on a strict hold-out set from November 2024 onward.
Fair-Odds Baselines
Before modelling anything more complex, we establish two standard baselines for comparison.
1. Proportional Overround Removal
Divide each SP by its implied probability share and scale them to sum to 1. Simple, widely used, and often surprisingly effective on favourites — but not on outsiders. This would be the most naïve approach to removing the overround and coming close to fair odds – basically reduce all prices by the same proportion as the overround itself.
2. Power Method (implied package)
Uses the “implied” R package, we can go much further. There are great off the shelf techniques if you know or are willing to learn a bit about using the R language (see R is for Racing! https://r4racing.net/) which fits a power transformation to implied probabilities to allocate overround more realistically across runners. More flexible than proportional scaling, but still a single function applied identically to every race.
Building the SP→BSP Model
The core hypothesis is that the relationship between SP and BSP is not linear, and not the same in every race.
To capture this, we treat the transformation as:
- Race-specific — each race has its own curve.
- Structured — BSP tends to increase at a changing rate as SP increases.
- Predictable — the shape of the curve varies systematically with field size, overround, and price skew.
Step 1: Overround-adjust the SP using the power method
This provides a “fair-SP” foundation.
Step 2: For each race, regress log(BSP) against log(fair-SP) and its square
This produces a simple quadratic curve unique to each race.
Step 3: Meta-model the curve’s parameters across all races
Field size, raw overround, fair-SP overround, and the skew of the price distribution explain most of the between-race variation.
This hybrid structure — a race-specific curve informed by global behaviour — turns out to match the real market closely without being brittle or opaque.
Model Performance on the Hold-Out Period
We compare:
- SP model
- FC (forecast) model
- Proportional fair odds
- Power fair odds
Against actual BSP.
Evaluation includes:
- MAE, RMSE
- Correlation of log-prices
- Calibration curves
- Error by BSP band
- Distribution matching
The SP model is consistently better calibrated than either fair-odds method, particularly in the tails where SP compression is strongest.
It does not eliminate error — no simple model can — but it reproduces the shape of the BSP market surprisingly well.
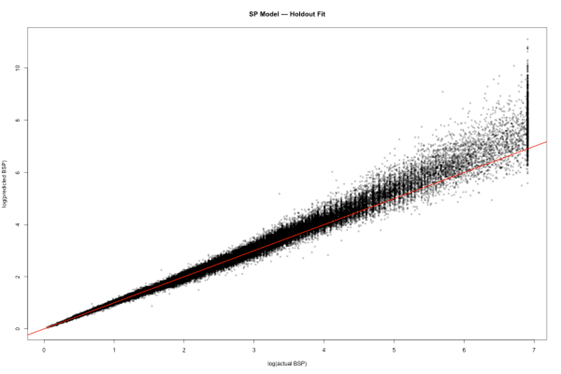
This scatter compares the model’s predicted BSPs with the actual BSPs on the hold-out set. Points falling along the diagonal show good agreement; systematic departures would reveal structural bias.
The plot shows that the model generally tracks the exchange well across the price range, with wider spread only in the far tails where noise is naturally highest.
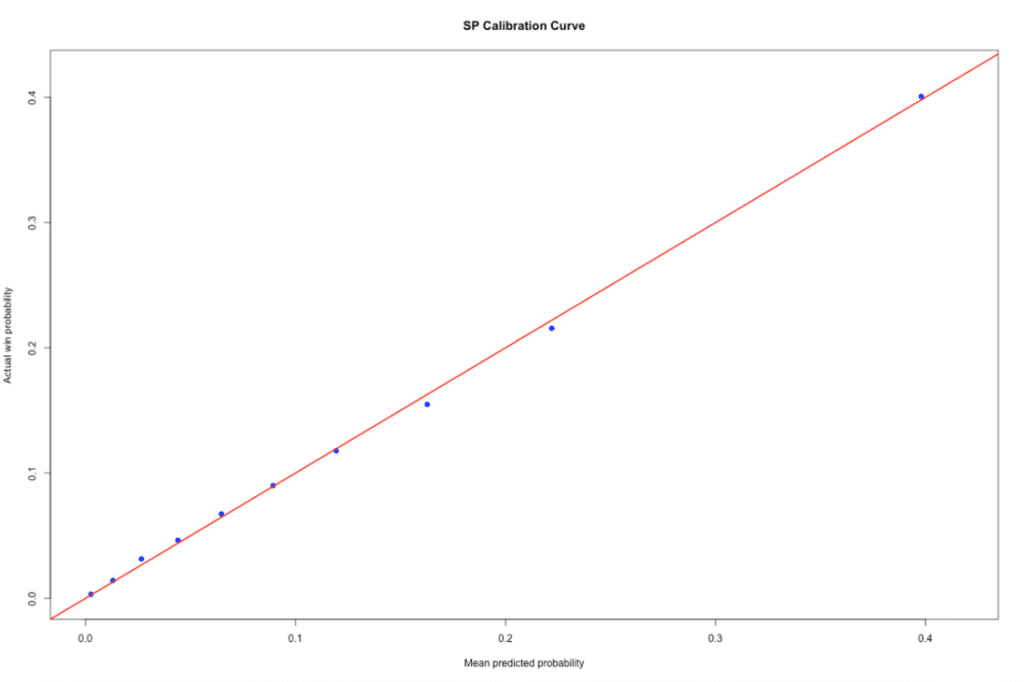
The calibration plot above groups runners by predicted win chance and compares each group’s average predicted probability with its observed strike rate.
Close alignment with the diagonal shows that the model is well-calibrated — a key property if we’re using it to benchmark value or to compare SP, BSP and forecast markets.
Examples
So much for the theory, below are two compact tables (rounded for readability) showing how the fair-odds baselines and SP model behave in practice, bearing in mind that we are trying to predict the BSP (and in the case of the Model SP, the structure of the market) with no prior knowledge except the SP of each runner I the race and the field size as raw inputs.
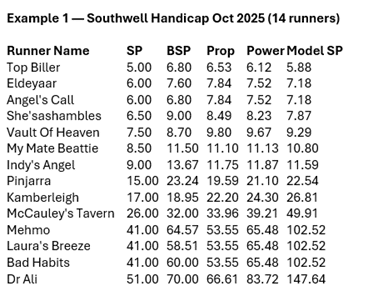
This race illustrates a common pattern:
SP is strongly compressed (overround ≈ 1.30), BSP sits close to fair levels, and the model corrects SP’s shape — lifting the outsiders more than the favourites but in proportion to observed historical behaviour.
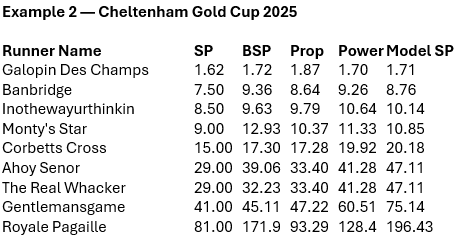
Despite being a high-profile Grade 1 with deep markets, the relationship is similar:
SP underprices the outsider tail relative to BSP; the model adjusts the curvature; fair-odds baselines capture part of the shift but not the full structure.
These two races, taken from opposite ends of the racing spectrum and different racing codes, illustrate the general behaviour we observe across the whole hold-out period. Although the amount of compression varies from race to race, the direction is consistent: bookmaker SP tends to push more margin into the outsider end of the market than the exchange ultimately supports.
Fair-odds adjustments reduce some of this distortion, but they work by redistributing probabilities uniformly or according to a single fitted curve. Real races don’t behave uniformly — their shapes differ depending on field size, competitiveness, the presence of strong favourites, and the degree of market uncertainty.
This is why the model takes a race-specific approach. Instead of assuming every race is built from the same hidden probability structure, we allow each race to have its own curve linking adjusted SP to BSP and then learn how those curves vary systematically across the population. In practice, the main drivers turn out to be the overall overround, how that overround is distributed, and how “skewed” a set of prices is (for example, where the favourite sits relative to the median price).
These influences show up consistently in the historical data, which is why they make useful predictors in the meta-model.
The hold-out evaluation confirms that this structure generalises well. The model does not collapse into overfitting individual races, nor does it revert to a generic rescaling. Instead, it preserves the broad shape of each market while correcting the systematic compression found in SP.
This is particularly valuable for the middle and long-shot regions, where SP is often tightest and where fair-odds transforms tend to under-adjust.
Taken together, the scatter plot and the calibration curve summarise these points neatly. The scatter shows whether the model captures the overall level of BSP; the calibration plot shows whether it captures the probability structure. The combination of the two is important because matching absolute prices alone is not enough — a model could be close in terms of numerical odds while being structurally mis calibrated.
The results here suggest that the approach not only tracks the exchange in broad terms but also preserves the probabilistic relationship between prices and outcomes. This matters for practical betting as well as for modelling.
If BSP can be viewed as a reasonably fair crowd-sourced reference point, then a model that reliably approximates BSP from SP becomes a useful benchmark for evaluating bookmaker prices long before the off. Early fixed-odds markets often operate at lower margins than SP but still inherit some of the same structural patterns.
Comparing those prices against the model’s implied “exchange-shaped” estimate makes it easier to identify when a bookmaker price is generous relative to typical exchange behaviour, or when it is short in a way that history shows is unlikely to persist.
In other words, the value of this modelling exercise is not confined to predicting BSP at the off. It also provides a way to understand how bookmaker markets evolve, how value shifts between early prices and late markets, and when an apparently attractive price is inconsistent with how similar races have traded historically.
This makes the model a practical tool for comparing SP, BSP and fixed-odds prices in a coherent and data-driven way.
Why This Matters
The point of all this work is not to produce a perfect predictor of BSP, but to better understand the relationship between two major pricing systems in racing. SP and BSP reflect different market structures, different incentives, and different kinds of information flow.
By modelling how one tends to map to the other, we gain a clearer picture of:
- how bookmaker markets compress or expand certain regions of the price distribution;
- how the exchange reshapes those probabilities under real trading pressure;
- and where, historically, fixed-odds prices have diverged most strongly from the crowd’s eventual judgement.
This makes the model a useful tool for pricing, analysis, and value assessment — and a natural next step from simple fair-odds transformations.
Future Work
There are several natural extensions:
- Incorporating time-of-day or pre-off trading windows.
- Using early exchange data to refine the curve dynamically.
- Extending the model to place markets or win/place combined markets.
- Bringing in race-level covariates such as surface, code, or seasonal patterns.
None of these are required to make the SP→BSP model useful today, but each offers a route to sharpen it further and will find its way into future volumes of our long term project, R is for Racing.
Colin Magee