Ten Year Racing Trends: Sorting out the “Wheat from the Chaff” – Part III
Ten Year Trends – Part 1 – Ten Year Trends – Part II
This is the final of a three-part series looking at using ten year trends in your horse racing betting.
Last year I wrote an article on the “less is more approach”. In that I highlighted that studies had shown that more variables you use doesn’t mean you become a more successful punter. The optimum number of variables you need to use are five.
The key is to sort out the “wheat from the chaff” and sort out the useful variables from the unhelpful.
In part one, I looked at the use of statistics in general and relevance regarding betting on horses.
Last month’s article discussed the use of ten-year trends in relation to favourites and how favourite trends can be successfully utilised when you are working with a decent sample size.
In this final part, I’m focusing on the use of ten-year trends when it comes to profiling a big race.
As promised, I will take you through step by step how I approach the use of the trends in shortlisting contenders for a big race.
Big Race Trends: My Approach
When looking at using trends to analyse a big race. The key remains to sort the relevant from the irrelevant trends.
Now the more trends you use the more likely “backfitting” will come into play. I am not a fan of the word I much prefer to use the word “overfitting”. In the main because by its very nature if you are using historic trends to look at a race you are to some extent “backfitting”. I don’t think there is any way you can avoid it.
Finding The Relevant Trends
The “less is more” approach is also very relevant when it comes to trending a race. I find the more trends that you use the less accurate the trends are likely to be. If you find that you can’t narrow down the field to four or five trends, then maybe that race isn’t one to be looking to have a bet in.
How do you find the most relevant or important trends for a big race?
It’s a good question and it’s probably the hardest thing to learn when it comes to trending a big race.
For some races the horses age or its Official Rating (OR) could be a significant trend. In other races it could be the days since last run or it could be last time out placing, or even the draw although the latter trend is only relevant to flat racing.
The Grand National, the Lincoln Handicap, The Chester Cup, The Ebor and Cambridgeshire all lend themselves well to ten-year trends analysis. All these races have been going for many years, they have large fields and thus a reliable sample size.
Arguably the most important aspect of trends analysis is that they can reveal elements that you may not have found by more normal methods of race analysis. Maybe a race favours younger or less experienced handicappers or higher weighted runners. Such information would be an essential element of assessment of the runners in a race.
The best way to explain my trending race analysis is by showing it you it in action. To do this I have chosen two different races, so you can see what trends I believe are the most relevant to that race
The two races I have chosen are totally random, in that I haven’t done a “less is more” trend analysis on either race before.
The first race I have chosen is the Lincoln Handicap, the first big flat handicap of the season and the second race is the Scottish Grand National at Ayr.
As ever the ever reliable www.horseracebase.com is my guide when looking at the trends for big races.
The Lincoln Handicap
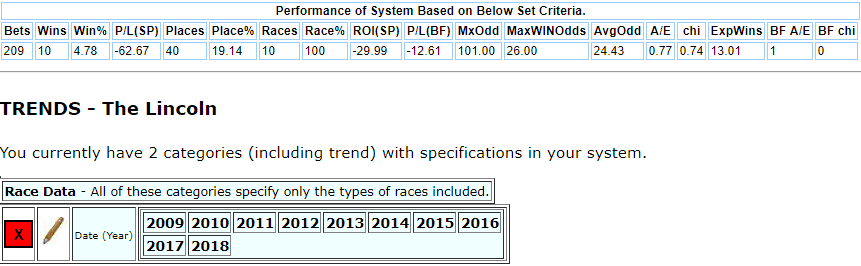
The Lincoln Handicap is run over Doncaster’s straight mile and normally attracts an average field size of twenty runners.
Here are the stats for the last ten renewals of the race.
Now, I am looking to find between 3 and 5 key trends that will provide clues as to the type of horse that may win the Lincoln this year.
So, what are the key trends?
Whatever the type of race, unless it’s for say 3-year-old’s only, age is this first thing I look at.
Age:
The first thing we can see is that horses aged 7+ are 0 winners from 47 runners 8 placed 17% when the expected winners should have been 2.
The most successful age group in recent years are 4-year-olds with five winners or 50% of the winners from 22% of the runners.
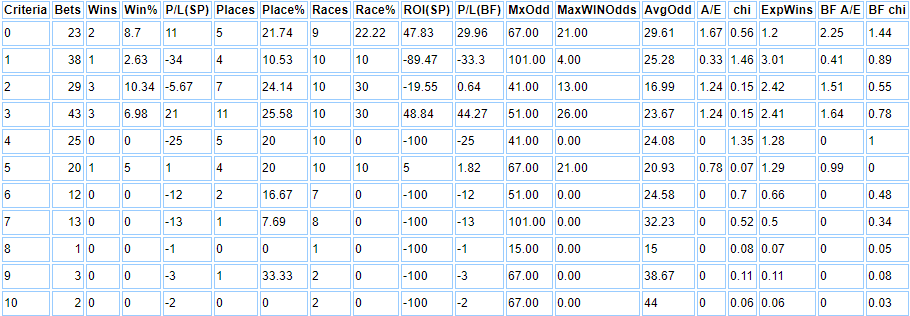
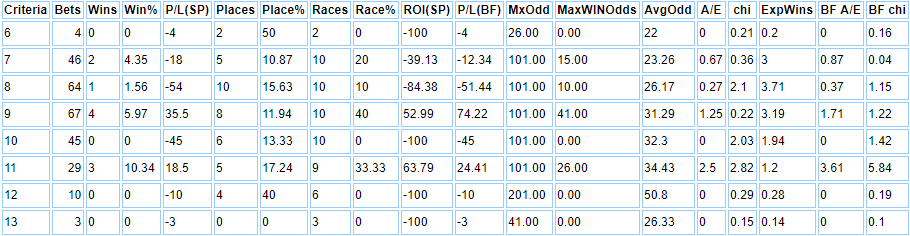
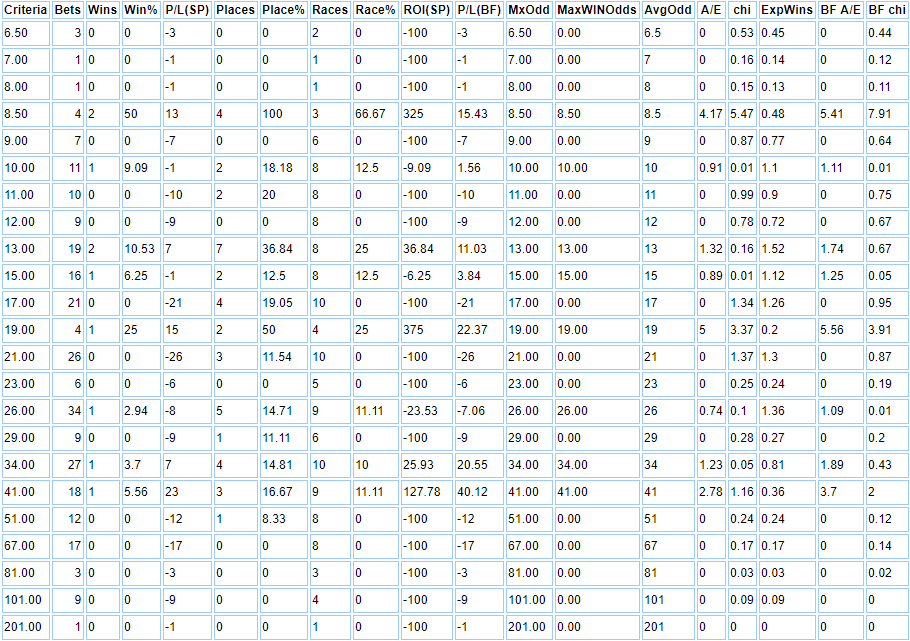
Odds SP:
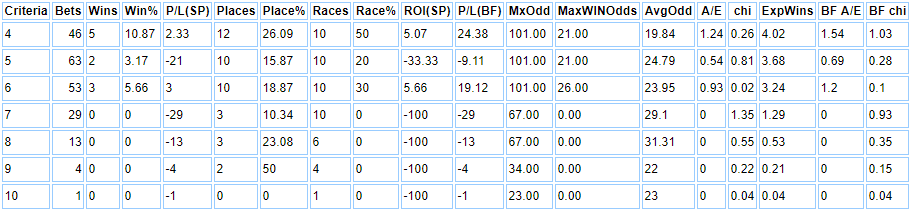
The next trend I will look at is Odds SP. The biggest priced winner of the Lincoln in the past ten years is 25/1 and the shortest is 3/1.
The sweetspots in terms of odds seem to be those runners sent off between 12/1 & 25/1.
Runners at such odds are performing 24% better than market expectations.
Meanwhile those runners going off 28/1 & bigger are 0 winners from 59 runners 3 placed 5%.
Official Rating:
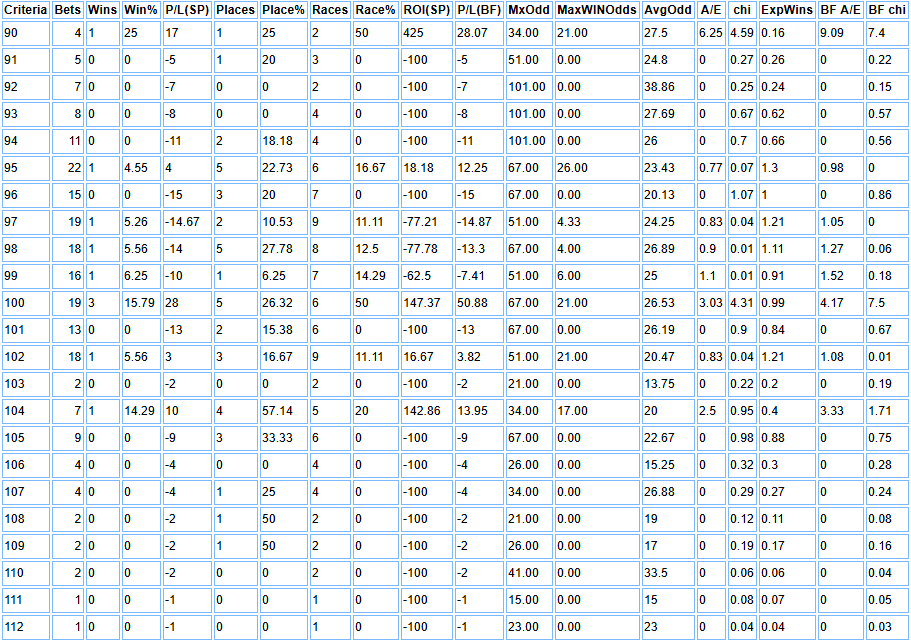
Not much to go here but those horses with a BHA mark of 105+ are – 0 winners from 25 runners 6 placed 24%.
Handicap Wins:
Runners with 4+ handicap wins are 1 winner from 76 runners 1.32% 13 placed 17%.
Draw:
As it’s a big field race on a straight track I will look at the effect of the draw, if any.
Using the draw segment tool on horseracebase we get the following:
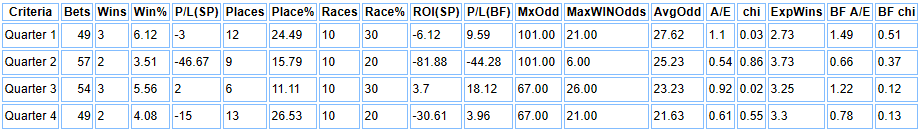
Looking at those results horse drawn closer to each rail have slightly outperformed those drawn in the middle two quarters.
Last Race Placing:
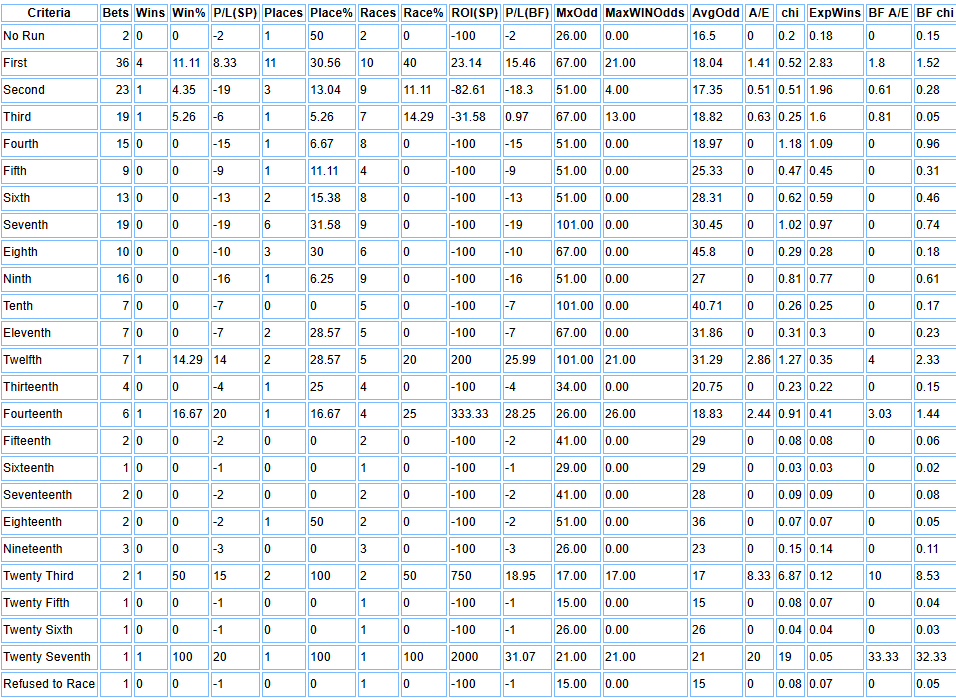
Looking at those results last time out winners are outperforming those runners who finished 2nd, 3rd or 4th on their last start – 2 winners from 57 runners 5 placed 9%.
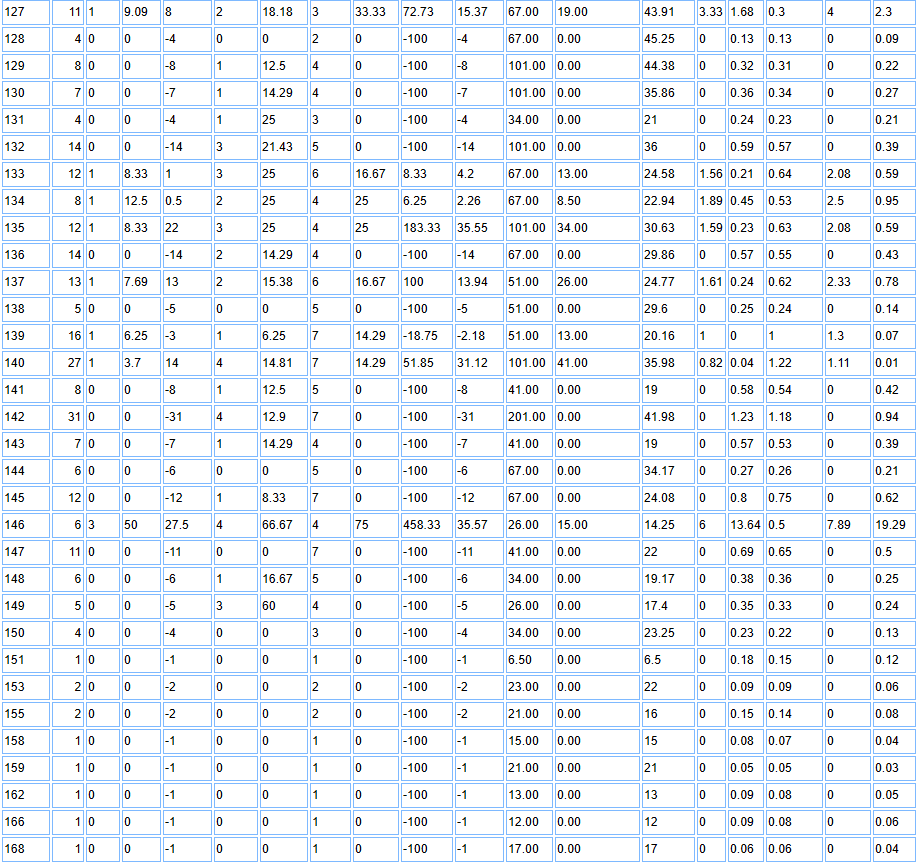
Days Since Last Run:
Given it’s the first flat turf meeting of the year the day’s since last run trend could be significant one.
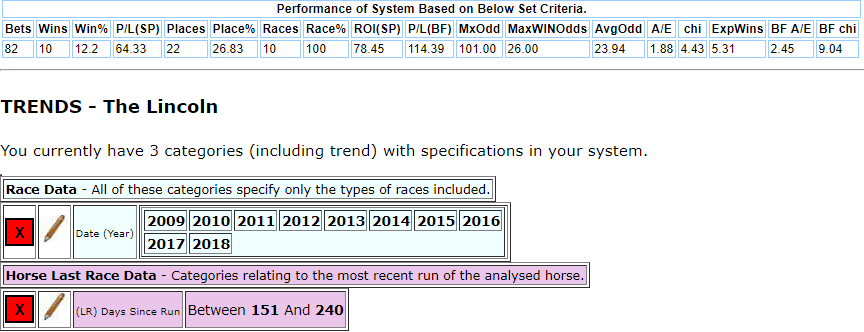
And so, it proved, albeit not the way you might have thought.
Now at this point it’s probably crucial to add that those results include two winners who had been racing out in Dubai at the Meydan Winter Carnival so had run in the previous 151 days.
In this case I would use the Meydan horses last run in Britain or Ireland.
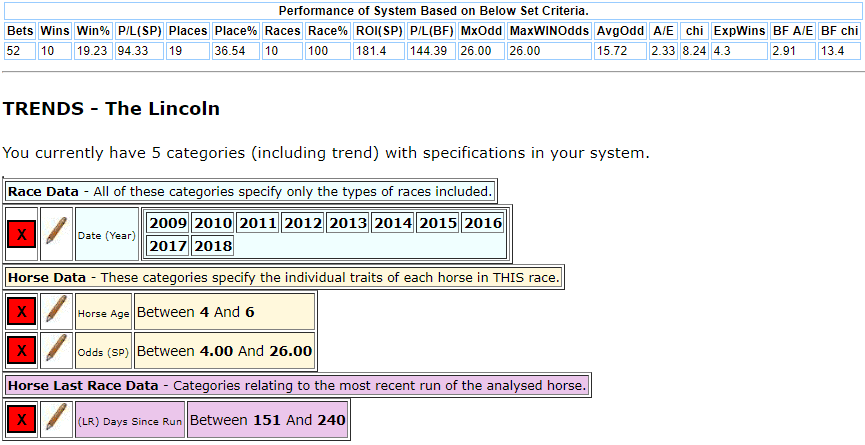
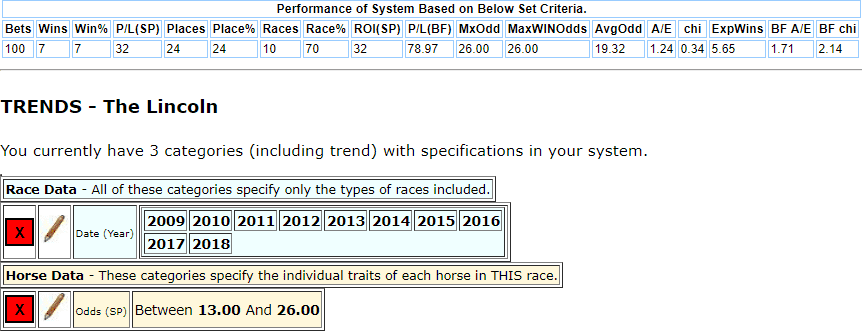
Looking at the trends. I would be happy to concentrate on runners with following traits:
- Horses aged 4yo to 6yo.
- That last raced in Britain or Ireland between 151 to 240 days ago, thus ignoring any runs abroad.
- That were sent off 25/1 or less.
So, we have 100% of the winners sharing those three categories from just 25% of the total runners.
There will be an average of about five qualifiers each year which can then be looked at and analysed using more traditional form study methods.
The Scottish Grand National
This 4m handicap chase is held each year in April.
I have used this as an example of my approach because it highlights some of the key differences between what trends are relevant on the flat but not over jumps and what applies to both codes.
Like the Lincoln it’s a race with a long history and one that attracts a big field. Thus, making it an ideal on for some trending.

If you had backed all 268 runners, you would have shown a loss to SP of £80 to a £1 stake.
As with the Lincoln what we need to narrow down the number of bets but at the same time find a high percentage of the previous 10 winners.
In the latter case I am looking to keep at least 80% of the total previous winners and at the same time cut the number of runners by at least half.
Age:
Once again starting with horses age.
Unlike the previous race winners have come from ages 7 to 11 and there are no age groups that standout.
Odds SP:
Nothing significant here.
There have been winners at 25/1, 33/1 & 40/1 and two at single figure odds.
Official Ratings:
Looking at the BHA mark.
Runners with an OR, below 133 and above 146 are 1 winner from 91 runners 1% -72 12 placed 13%, they could have been expected to have had 4.47 wins.
Last Race Placing:
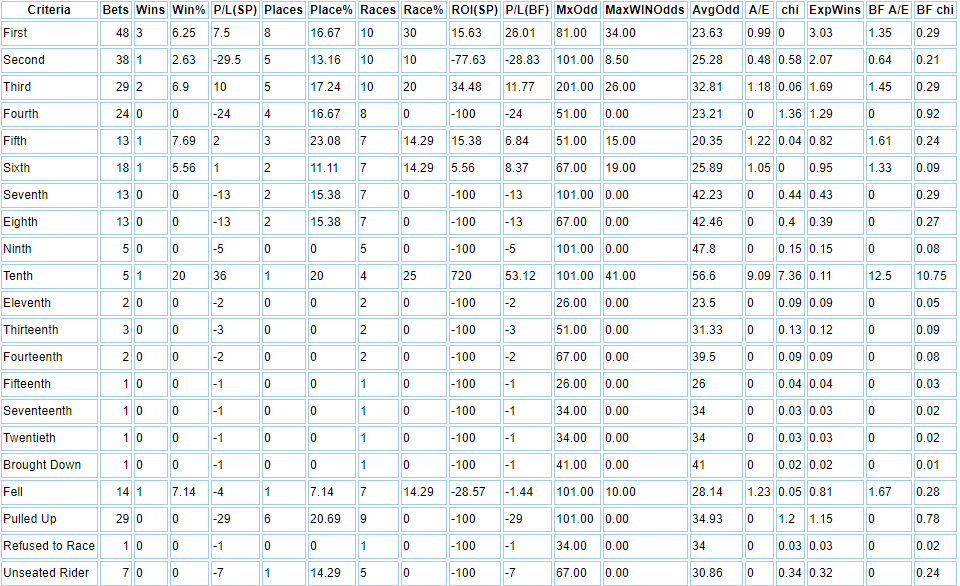
Horses that finished in the top six on their last start have won eight of the last ten renewals but they did provide 63% of the total runners.
Days Since Last Run:
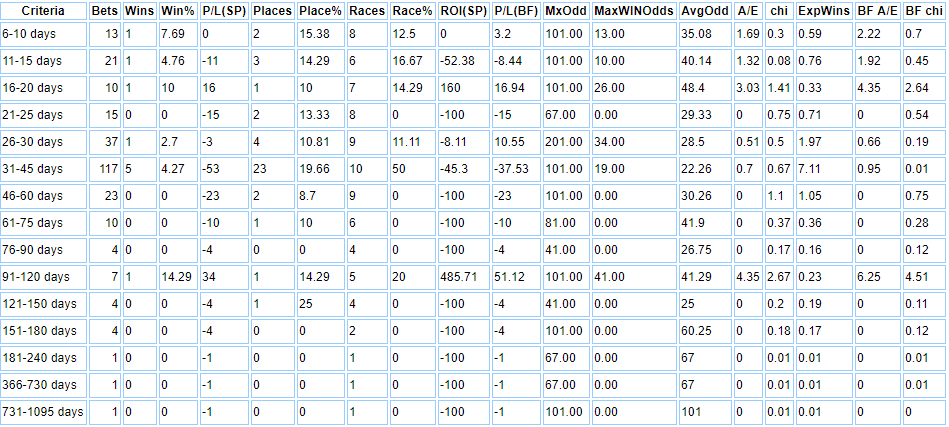
Again nothing too significant although 90% of the winners had run within the previous 45-days they provided 79% of the runners.
Given this is National Hunt race we don’t need to worry about the draw.
Runs In Season:
As the race comes at the end of the winter jumps season. It’s worth checking to see the importance of number of runs that season.
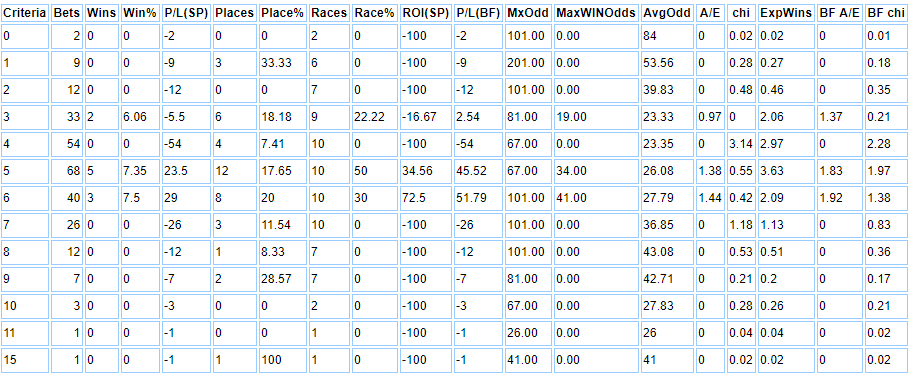
And we can see that you don’t want runners that have had less than two runs that season or had seven or more. Such runners are – 0 winners from 71 runners -73 10 placed 14%.
If you had backed all those qualifiers you would have lost £71 to a £1 stake.
Runs Since Last Win:
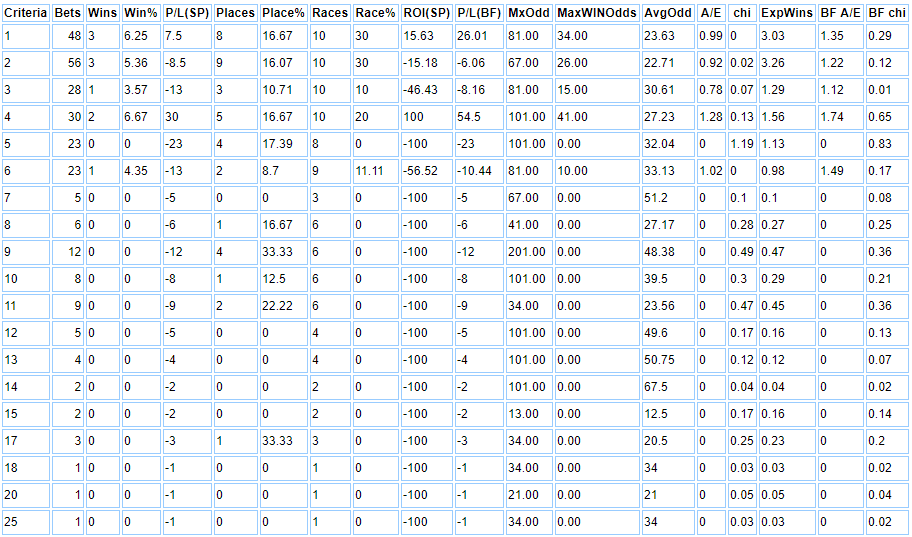
What stands out here is that a recent win is an important factor.
Those that had gone 5+ runs since their last win are 1 winner from 105 runners -95 15 placed 14%. The expected number of winners should have been 4.51.
Headgear:
Whatever race, flat or jumps, I am trending I will always take a glance at headgear and it’s impact on the results.
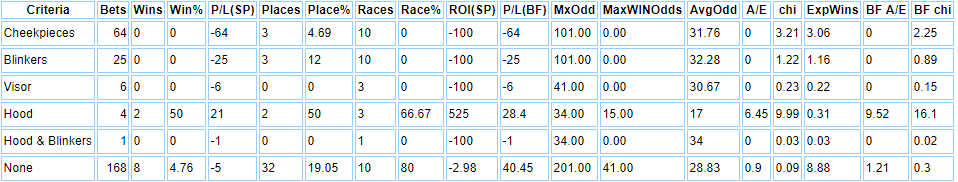
In the last ten years just one horse has worn headgear to win the race and that was Vicente in 2016 & 2017. Interestingly horses wearing blinker, cheekpieces or a visor are performing well below expectations – 0 winners from 96 runners -96 6 placed 6% – we could have expected such runners to have won 4 races.
Scottish Grand National Trends Verdict
Going by these ten-year trends you can see that the winner is most likely to:
- To have a BHA mark between 127 to 146.
- To have had between 3 or 6 runs that season.
- Would not be dropping back in class from their last run.
- And not wearing headgear or hood only.
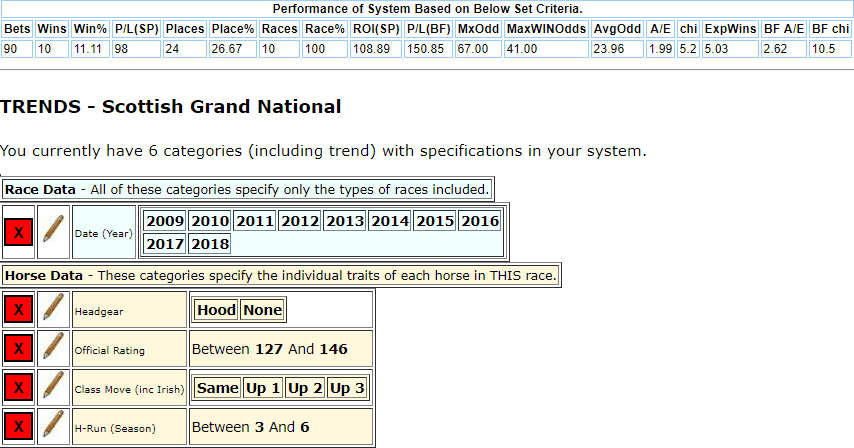
Using the above four filters gives us all the last
ten winners of the race from just 34% of the total runners.
You can use those filters to cut down the field to small group of contenders
before analysing race through form, speed or whatever method you use.
It’s very simple, yet powerful, approach! And it’s one that I have been using
to good effect at this years Cheltenham Festival.
In summary: Ten-year trends are a fantastic tool to use when it comes to
looking at big races either handicap or non-handicap. Using the “less is more”
approach to trends analysis is key to improving your betting. You really don’t
need to be using lots of filters. Indeed, the more filters you use the more
confusing the analysis and the less reliable the trends become.
Well I hope you have enjoyed this short series on ten-year trends and their
usefulness to your betting.
Until next time!
John