Trying To Find Value Using Betfair SP
Making money from horse racing has never been easy, but I would guess a bigger percentage of punters are profitable now than say 25 years ago. Nowadays with the Exchanges and Best Odds Guaranteed there is more arguably more scope to find some value. We are not tied to Industry SP and / or Early Prices like we were back ‘in the day’.
In this article I am going to see where the Betfair ‘value’ has been in relation to National Hunt racing in the UK. I am examining data starting from December 2007 when the Betfair Starting Price was launched, and going up to the end of September 2022, which was when I was researching this piece. Now when I say ‘value’ I don’t necessarily expect to be finding easy routes to long term profits, I am more looking for the best value when using Betfair Starting Price.
I will be using Betfair SP in price ‘bands’ or ‘brackets’, and all profit / loss will be calculated as if betting £1 win level stakes on each bet. I have adjusted returns to take into account standard commission on winning bets.
Betfair SP – Results by Price
I want to start by splitting the National Hunt results purely by price. Clearly with Betfair SP we need to go right up to a price 1000.0 so I have grouped them in a way which I feel is sensible and fair.

No surprises to see all price groups in the negative, and it is not very even as one might have expected.
The results also suggest to me there is a pattern here.
This pattern is probably more easily appreciated if I graph the Return on Investment % losses. (I haven’t added the 200.01+ ROI% data as that would have made a really lopsided graph).
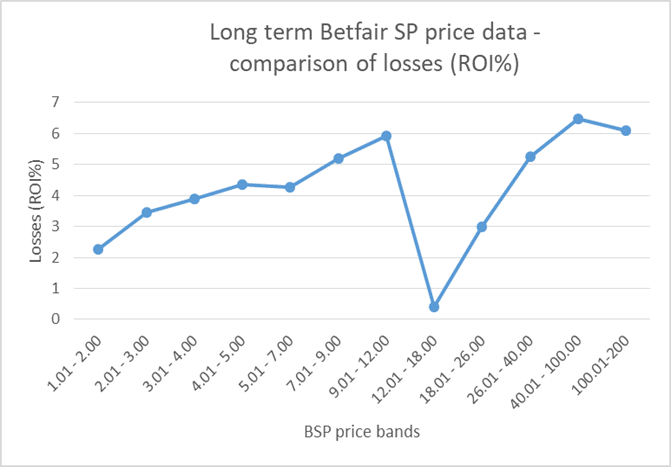
As the graph shows, the very shortest prices (Evens and odds on) only lose around 2 pence in the £, but as the prices move up, so do the losses. This continues to the 9.01 to 12.00 bracket where losses are close to 6 pence in the £.
Then we get a big improvement in returns when we hit 12.01 to 18.00 where losses are down to just 0.4p in the £.
The next price band of 18.01 to 26.00 sees a movement back up a little giving losses of roughly 3%.
The losses generally continue on an upwards trajectory remembering that 200.01+ prices (not shown) lost nearly 50p in the £.
It seems therefore we have what we could term a price ‘sweet spot’.
With back fitting, please note this is not something I advocate, the ‘best’ sweet spot has been prices between 12.50 and 19.00.
Within this price range it would have seen you break even. However, despite knowing this I am going to dig a bit deeper sticking with the 12.01 to 18.00 price bracket I used from the outset.
Let me look at the breakdown of the 12.01 to 18.00 price bracket by ‘Year’.
I am look at the data in a slightly different way than simply looking at individual years. I will use a method I first saw in Nick Mordin’s excellent book ‘Winning Without Thinking’, where he looked at data by grouping a batch of years together, which is one way to try and compare data more effectively.
As we know we can get random good years and bad years with data sets, so this method helps ‘smooths out’ such anomalies. Also, there is potential to more easily appreciate whether patterns are changing.
I have chosen to look at 6 yearly batches starting with the combined data from 2007 to 2012 for the 12.01 to 18.00 price bracket and taking us right through to 2017 to 2022.
Here are the findings:
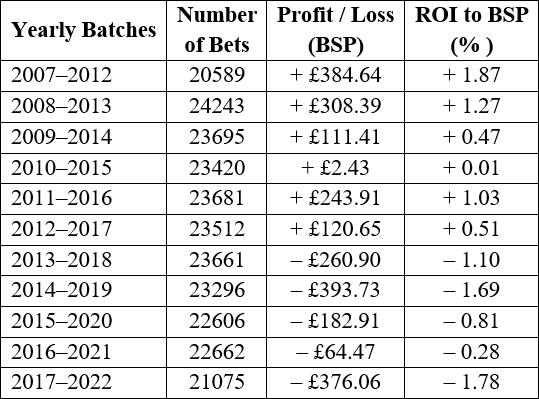
Doing it this way has helped show up what seems to be a definite pattern.
It seems that there has been slightly less ‘value’ in more recent times. Having said that, the ROI% figures are remarkably similar across the years, so as far as Betfair SP prices go, this still looks the area where we have an ‘edge’ over other price brackets.
Let me now compare some specific racing ‘angles’ within this 12.01 to 18.00 price bracket.
For Gold and Platinum readers Dave tells us which horses to target to score a positive ROI, you can upgrade to a Gold or Platinum account now by clicking HERE
Already a Gold or Platinum member? Read the full article in Issue 97