Your Place or Mine – Part One
As if it were not difficult enough to decide when to make a straight win bet, we are faced with various options for our selection to place in the top 2, 3, 4, … as well as each-way covering both the win and place possibilities. Which opportunities are profitable and which simply enticements to unfavourable wagers?
Avoid Soft Betting Patterns
Consider a theoretical race consisting of 11 runners at fair odds of 10/1 against. The usual bookmaker place fraction of 1/5th for a top three finish would result in a place pay out at 10/5 = 2/1 for three of the contestants. In other words, 11 place stakes returning 3x (2+1) = 9 stakes: no thank you. Even if the layer offered place odds of 1/4, the total pay outs would still only amount to 3x (10/4+1) = 10.5 stakes for 11 in.
Should we be tempted if a layer offers more typical prices of 9/1 and four places at 1/5th? Returns are then 4x (9/5+1) = 11.2 stakes giving the backer an edge of 0.2/11 or 1.8%: yet this potential place edge is wiped out by the win margin of 9x (1/11)-1x (10/11) = -1/11 i.e., a 9% negative edge.
Now there are sites which list the ‘special’ place odds available each day e.g. What Are Today's Extra Place Races? » Which Bookie and Oddschecker specifies the situation by race …
… but the more heavily an event is promoted by bookmakers at large, the more likely it is to feature a soft betting pattern, where the favourite is not all that distinguishable from the other runners, and the large field is much of a muchness.
Look for Hard Betting Patterns
From the sublime to the ridiculous: our second theoretical race is a 1 mile, flat event featuring three classes of performers:
- any racehorse
- the current Olympic 1500m champion
- any six able-bodied, senior citizens, giving 8 runners at 1/5th a place.
Continuing to exercise our imaginations to its fullest, the odds might be:
- 100/1 ON the horse
- 100/1 AGAINST the athlete
- 1000/1 AGAINST the seniors
Barring a miracle of some sort (miracles on Betfair are also priced at 1000), £100 EW on all eight would return from £1,600 staked:
- horse: £1 win, 20p place, £200 win, and place stakes
- athlete: £2,000 place, £100 place stakes.
- one senior: £20,000 place, £100 place stakes.
- the other five seniors: nothing
Performing these silly calculations shows at once that the arbitrary fraction of 1/5th the win odds can yield favourable place odds when the favourites in the field consume most of the market i.e., a hard betting pattern obtains.
Measuring Hardness
Since neither illustrative scenario exists in the wild, it would be useful to have some measure of a specific race’s betting pattern hardness to flag potential betting opportunities.
Readers are no doubt familiar with calculating the race over-round: the chances implied by the win odds across the entire field.
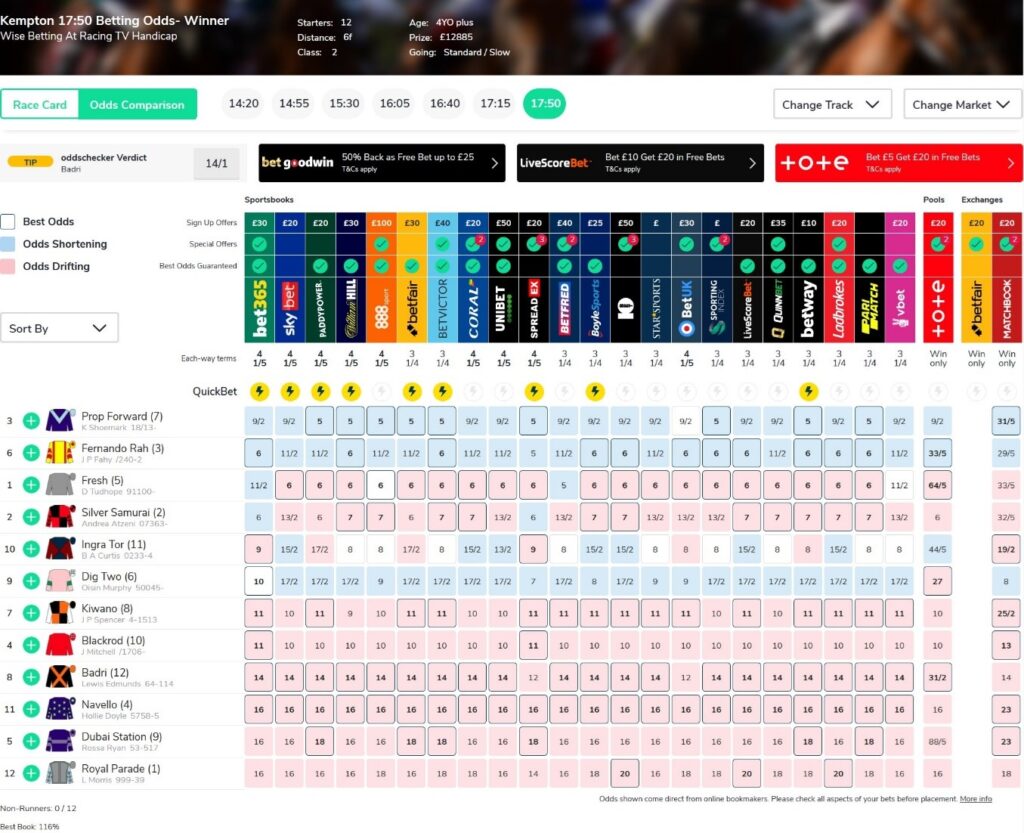
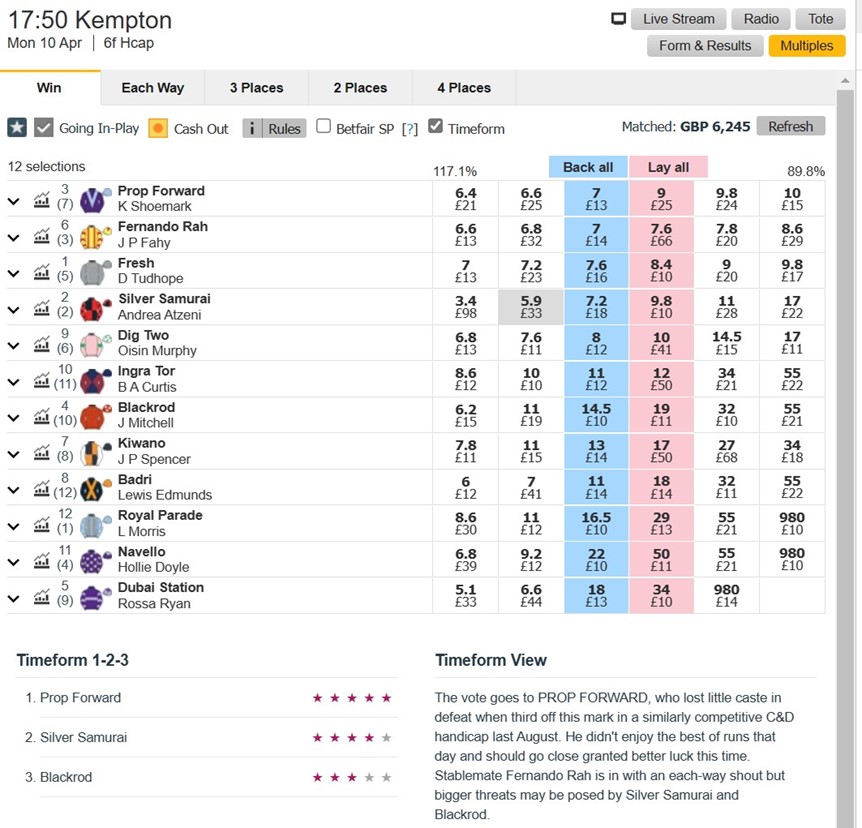
The next race example is another from Easter Monday’s 2023 events.
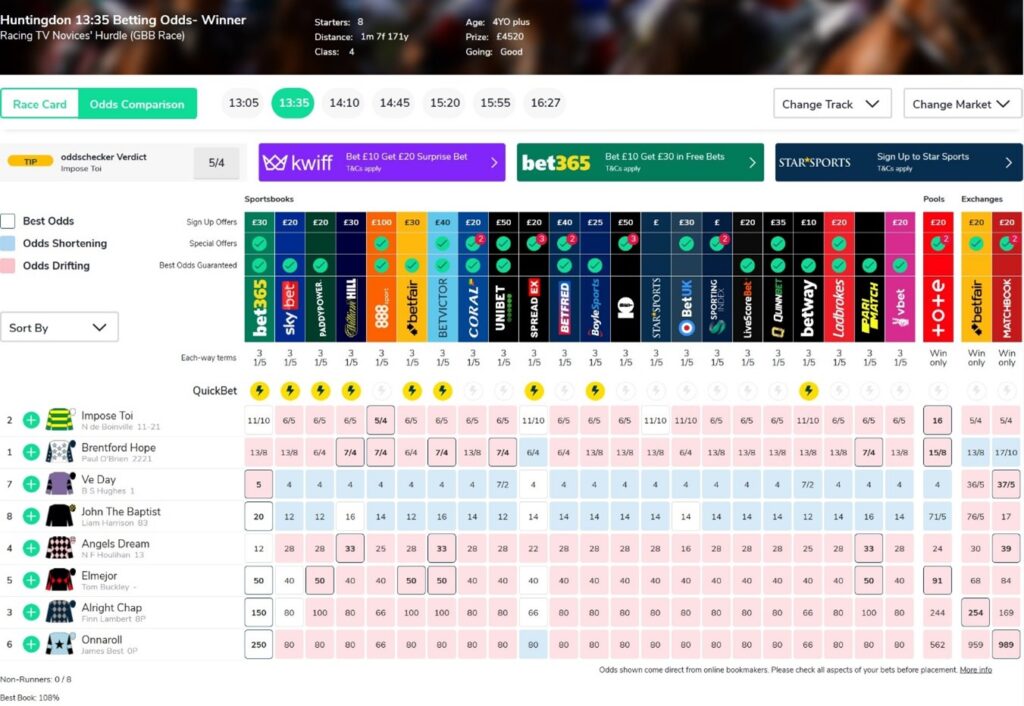
The favourite is at best odds of 5/4 AGAINST, its implied chance of winning is therefore 1/ (5/4+1) or 0.44 to two decimal places. Using the same computation for each runner in turn … and adding up all the chances gives the win over-round (WOR):
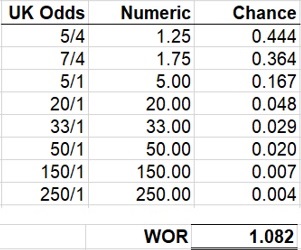
Were all the odds fair, then we would expect an over-round of exactly 1.000.
A figure greater than 1.000 results from the layers reducing their prices to produce a set of what they hope are unfair odds on all runners.
Producing the place over-round simply requires multiplying the win odds by the place fraction to give the place odds … and then following the same accumulating procedure as for wins.
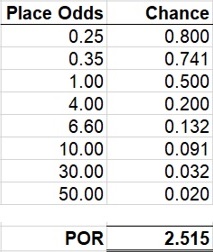
If we expected an over-round of 1.000 for the sole winner, what over-round should we expect for three places?
Should it not be 3.000 for the three?
Instead of being over, the figure is under. We say the place chances are over-broke … and that means potentially favourable!
Speeding Opportunity Identification
Calculations are already tedious (and the reader hasn’t yet seen the others I am about to suggest!), so the first spreadsheet accompanying this article accepts odds lines from Oddschecker and Betfair, making it easy to identify hard patterns: see Place Calculator.xlsm.
The first block of figures to consult for the example race looks like this:
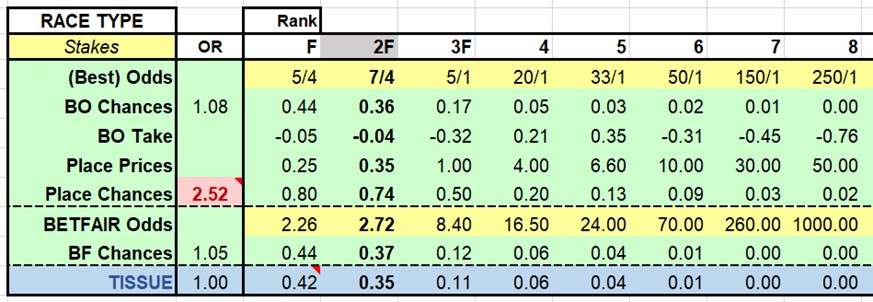
Proceed by rows, filling the yellow cells only:
- Enter the Best Odds one at a time: there is a dropdown list for each cell which will only accept a valid UK price. These fields are all text to accommodate prices such as 4/6, EVENS, 85/40 and so on, which would otherwise be changed by EXCEL. (There is a hidden row which converts the text to numeric form.)
- The BO Chances in the green cells will be calculated at once e.g., odds of 5/4 will become a chance of 0.44, as discussed in detail above.
- The BO Chances will be summed automatically to produce the win over-round of 1.08.
- Forget BO Take for the moment.
- The Place Prices will be calculated at once by multiplying the Best Odds by the place fraction.
- The Place Chances will be calculated at once.
- The Place Chances will be summed automatically to produce the place over-round 0f 2.52. An over-broke situation will be shown in red highlighting.
- Enter the BETFAIR Odds one a time: again, there is a drop-down list from which to pick valid prices.
- The implied BF Chances will be produced at once.
- The win over-round of 1.05, according to Betfair, will appear at once.
- The final row TISSUE, in blue, modifies the BF chances; rescaling them by the Betfair win over-round to generate an estimate of true odds.
- Returning to BO Take, assuming the Tissue is fair, this row shows the unfair edge of the best bookmaker price.
A promising beginning then: the over-broke set of place chances from a hard betting pattern … combined with a field of two strong market leaders, a decent 3rd favourite and uninspiring outsiders … bodes well.
Refining Candidate Selection(s)
Everything points to favourable place odds for the market leaders: but how is that favourability distributed? Across all 3? Concentrated in one runner? ‘Depends’?
The bookmaker’s calculation of place chances is fixed and inaccurate: is there a way to produce a better estimate from the win odds?
The first documented attempt to generate place odds was made in the 1970’s: Harville, D.A. (1973) “Assigning Probabilities to the Outcomes of Multi-Entry Competitions,” J. of American Statistical Association, 68, p.312-316. The method splits the problem of placing into four calculations:
- The chance of winning: that’s easy, the chances in the tissue generated as above will be a good estimate of true odds, given the efficiency of the Betfair market.
- The chance of finishing second. If we assume the favourite wins the race, then we can construct an updated odds line by removing the favourite’s win chance from the overround and compare the chance of another runner beating the remaining field: effectively a race ‘without the favourite’.
For example, suppose the favourite is a fair 4/6, then it is expected to win 60 of 100 races. If the second favourite is a fair 4/1 then it is expected to win 20 of 100 races.
- The field is expected to win what’s left – 20 races in 100. Taking the favourite out leaves only 40 races, of which the second favourite wins 20 and the field wins 20: in other words, the second favourite is EVENS ‘without the favourite’. This is the source of place favourability, and the error in a fixed fraction, for the chance of the second favourite beating the field is not bound to the chance of it winning by beating the favourite.
- The chance of finishing third: is more of the same. Now we take out two runners and compare the chance of a selection against that of the field bar those two. Say the third favourite is 9/1 then it is expected to win 10 races in 100. Removing the favourite (60 races) and the second favourite (20 races) leaves 10 races for the third favourite and 10 for the field: the third favourite is EVENS to finish third.
- Accumulate the sum of chances over all race finishing permutations.
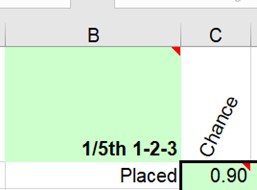
The block headed 2F RETURNS (below the TISSUE generating section) calculates the chances of the second favourite placing …
… finally producing a figure in cell C2.
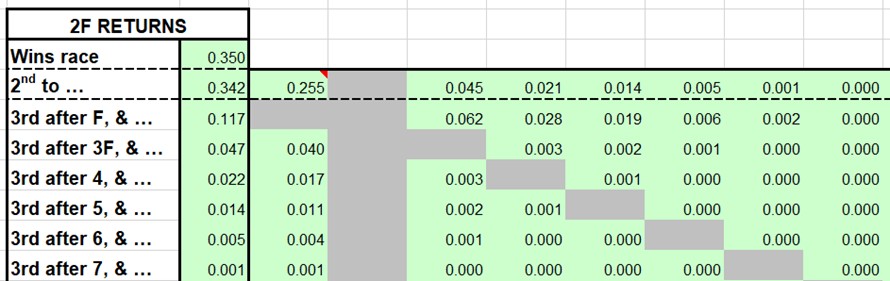
In reality the Harville formulae were found to be too optimistic in estimating place chances … but they are nonetheless useful as an indication of where to look. (In time, and with practice, the mental arithmetic necessary to calculate the total chances of the front runners will become second nature.)
Market Analysis
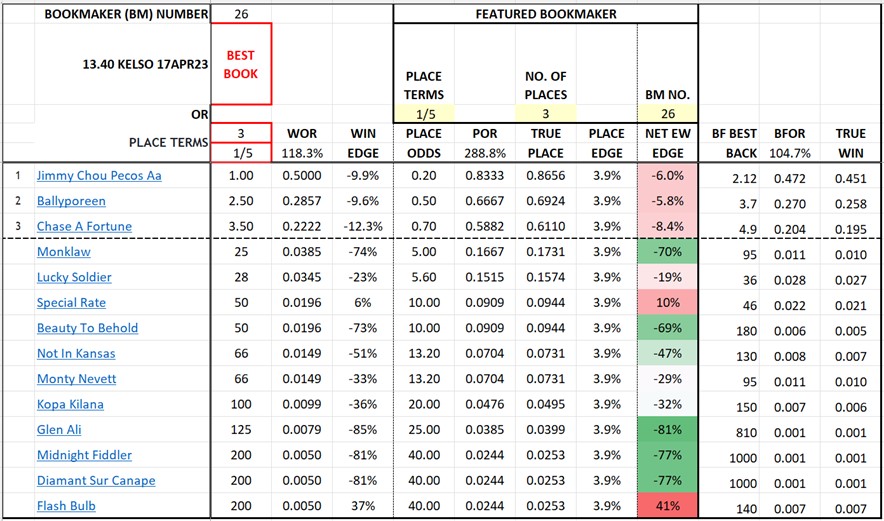
Having identified a candidate for closer examination, the second spreadsheet, Place Examples Racing.xlsm, focusses on the markets’ view for a specific race. The race worksheet Kelso 13.40 is first populated with the odds table from Oddschecker, representing the bookmakers’ view of the event, and then the corresponding best back offers from Betfair, revealing at once:
- the win overround for each bookmaker
- the win overround for the best odds available across all bookmakers
- the place overround for the best odds
- the Betfair overround
By setting the cells with a yellow fill the user can highlight an individual bookmaker (the best book is bookmaker number 26), should he/she so choose.
Given that the market has settled, an estimate of ‘true’ win odds is generated by rescaling the Betfair win odds by the Betfair overround, allowing calculation of …
- the win edge for the bookmaker’s price
- the place edge for the bookmaker’s price
… which is closing in on the figure we really want to know: the net EW edge!
Click here to read how to handle the operations for a single selection.
John Jackson
Featured Image: (CC BY 4.0) – The Race I | Matt | Flickr