The strongest draw biases over 6 or 7f
Back in March I looked at draw bias over 5 furlongs with a view to revisiting the topic soon afterwards. A few months on, that is exactly what I am doing. In this article I will not be sharing all the figures for all the course and distances for 6 to 7 furlongs, as that might end up looking like a barrage of numbers. For this piece therefore I will be picking out the strongest draw biases only. I am also focusing on turf courses only, so no all weather courses.
This article is part of our Complete Draw Bias Guide — covering every UK course and distance in one place.
I am taking draw data from the last seven full seasons in the UK (2016 to 2022) focusing on handicap races only with 8 or more runners.
I have mentioned before that when examining the draw and any potential draw bias I tend to look at handicap races only. This is because handicaps by nature are meant to be competitive – essentially the handicapper is hoping all runners will finish in a straight line.
In addition to the competitiveness, there are also a good number of handicaps each year which helps with data sets.
The number of runners is important also and eight runners is always my minimum – races with 7 or less runners lack validity in my opinion when it comes to draw bias analysis.
I am going to split into distinct quarters (quartiles) of the draw and I will simply call them Quartile 1, Quartile 2, Quartile 3, and Quartile 4.
Quartile 1 stands for the lowest quarter of the draw, Quartile 2 will be the second lowest quarter, Quartile 3 will be the second highest quarter, Quartile 4 the highest quarter.
As we are splitting into quarters / quartiles the percentages should be around the 25% mark assuming there is no potential draw bias in play. Clearly the further away the percentage is from 25 (above or below that mark), the more likely a draw bias exists. I am going to work through in alphabetical order and the first course and distance to have strong enough looking stats is Ascot over 6f.
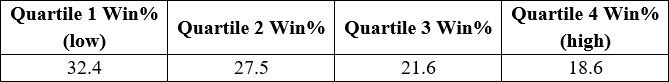
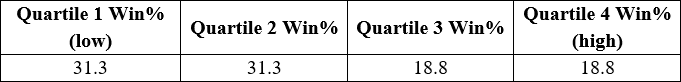
Ascot 6f
Here are the draw splits for this C & D:
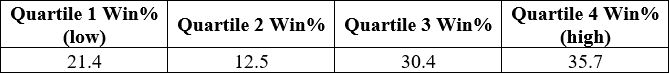
A definite edge to higher draws with the highest quartile scoring the most.
Overall, the top half of the draw have had roughly double the number of winners compared with the bottom half. The placed stats back up the win stats which always adds confidence to the findings.
Why higher draws have an edge is probably down to the fact that the ground closest to the stands’ rail (high) sometimes turns out to be slightly quicker than the rest of the course.
Beverley 7f
30 years ago, horses drawn next to the inside (low) had a very strong edge over this trip. The edge is less strong these days, but it still exists as the figures below show:
The closer to the inside rail you are the better. Horses drawn 1 have won 14 of the races, the only stall to have secured a double figure number of wins. Backing that stall blind would have turned a profit to both SP and BSP.
There is a run style bias too at this distance so a low drawn front runner should give you a very good run for your money.
Chester 6f
On to the unique Chester track now, starting with 6f:
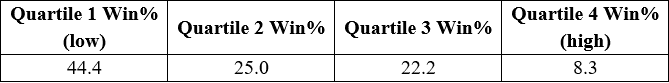
Draw bias at Chester is well known and it is down to the tightness of the track, and this accentuates the bias to the inside rail (low).
As we can see from the win percentages, we can see the lowest quartile has a huge edge, while the highest quartile really struggles.
It should be noted that draws 1 and 2 have accounted for 16 of the 36 winners, while horses drawn 10 or higher have had 0 winners from 56 runners.
Chester 7f
Chester appears again, over the extra furlong now:
No surprise to lower draws in charge once more.
The extra furlong does not really negate the bias as half the races have been won by draws 1, 2 and 3.
Be aware though that there are not many qualifying races each year over this course and distance.
Goodwood 7f
The Sussex track was my local for many years and this distance has always been my favourite.
Here are the draw splits:
Horses drawn in the lowest half of the draw have had a very clear edge over the past seven seasons.
You really don’t want to be drawn in double figures here – of the 198 horses who have been drawn 10 or higher only 6 have won.
Compare this to the 68 horses who were drawn 2; of these 15 went on to win!
The bias is also slightly stronger in bigger fields simply due to the fact that higher drawn horses have further to travel due to it being a turning 7f.
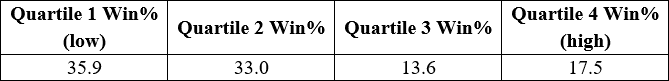
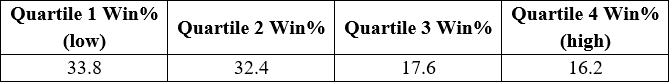
Leicester 6f
To the Midlands now and Leicester over 6f:
We can see from the draw splits that the bottom half of the draw have had the advantage here.
Horses drawn 1 have won 12 of the 64 races and have been clearly the most successful individual stall, while 34 of the 64 races have been won by horses drawn 1 to 4. It is not a huge bias, but a nagging one that we should know about.
We should also be aware that the low draw bias strengthens as the ground eases — see the seasonal draw stats. Hence on good to soft or softer I would definitely prefer to be drawn low rather than high.
Redcar 7f
A look at Redcar over 7 furlongs now:
Lower draws have been preferable over this C & D for some time.
The lower draw bias is at its strongest in big fields and fortunately you do get some big field 7f races here.
There have been 11 races with 16 or more runners since 2016 and remarkably the lowest quartile has provided 8 of these winners. Two came from the second quartile and one from the fourth quartile. In terms of win and placed horses (16+ runners), the lowest quartile provided 24, the other three quartiles combined managed just 20.
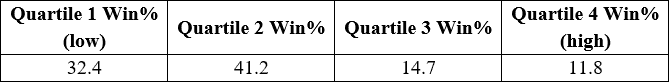
Pontefract 6f
One of my favourite tracks to bet on is Ponte.
Here are the 6f draw splits:
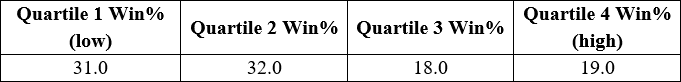
Virtually identical figures to Leicester over 6f.
Lower draws can take advantage of the left turn over this sprint distance which seems key here. 41% of all qualifying races have been won by horses drawn 1 to 3. Once we get to draw 10 or higher, horses do seem to struggle.
As a rule of thumb, draws 1 to 3 are more than twice as likely to win as horses drawn 10 or higher.
York 6f
The stats for this trip at York are as follows:
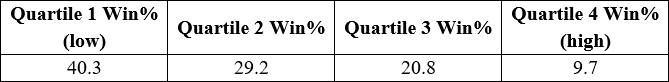
The lowest quartile has been over four times more successful than the highest quartile. Hence a low draw is clearly preferable here. Indeed, you could have backed draws 1, 2 and 3 ‘blind’ over the past seven years and you would have made a profit on each stall to not only BSP, but to traditional SP as well.
For the record draws 5 and 6 also turned a blind profit!
It should also be noted that the bias seems to be even stronger once the going gets good to soft or softer.
Conclusion
So, it looks like we have at least nine playable biases over 6 and 7 furlongs to add to those I highlighted in the 5f piece back in March. Draw bias may not be as prevalent as it was back in the 70s, 80s and 90s, but it is still around. You just need to know where to look.
Before I go a quick thanks to www.horseracebase.com – I pulled the draw data for this article from there, and if you have not checked out the site, I suggest you do.
David Renham