Backtesting may not be as boring as it sounds…
This is the third (and final, for the time being) of a series of articles about creating and using oddslines. Whether you are planning to create your own machine learning models or use an existing oddsline generated from one, thoroughly backtesting results and potential strategies is key to finding profitable angles and using them with any sort of confidence. While backtesting can sound dull (and setting up the mechanics can indeed be tedious), the results, and more importantly, the insights into your model, can be fascinating. Here, we’ll present some of those insights from the new All Weather Oddsline we’ve created.
The articles to date have been quite technical, so here’s a quick recap on the process of creating a horseracing oddsline using machine learning methods but cutting down on the jargon. This recap is relevant to backtesting the oddsline and uncovering hidden strategies, since we’re going to explore what the model captures and (most importantly for discovering opportunities) what it does not take into account—so bear with us.
We start with raw data and so-called “features” derived from that raw data—for example, previous finish position or derived data like trainer strike rate over the past 5 years. Using the Smartform database is ideal, as it allows programmatic access to over 20 years of daily horseracing data (more than 2 million rows and hundreds of columns), enabling us to select raw features of interest and derive new features on the fly. Many models are possible with Smartform, so if you want to create your own oddslines, this is the place to start. Indeed, the Betwise research page showcases example academic papers where Smartform has been used for precisely this purpose (see: https://www.betwise.co.uk/research).
But back to the process – we end up with a bunch of features we think are significant – these are potential ingredients to the model. We can statistically test the features that are most important against the outcome we are trying to predict (e.g. winning, placing, finishing rank), and start to use modelling methods to arrive at the perfect blend of features that will most accurately predict our outcome. Something that trips many users up who start creating these models for the first time is the requirement to use data that is only known *before* the race. Sounds obvious, but when you’re working with historic data, this kind of “data leakage” can be hard to spot, and if you don’t spot it, you’ll think that you have come up with the golden goose, whereas in fact you have invented a dead duck.
Assuming however that the model is clean and the ingredients for the model are the same as you can reliably create before any future race, the model will essentially give us the right mix of features to use in the right proportions. These can then be applied to any new “row” of horseracing data to come up with a probability of winning for the horse in question. At the risk of giving away some of the crown jewels, some of the top features in the mix used by our all weather flat model (in no particular order) are:
horse’s maximum speed rating, performance of the horse last time out, breeding, class of race, trainer and jockey statistics (especially relating to course, distance and recency of form), and whether or not the race is a handicap. There are many more, but these account for 90% of the model’s predictive power.
However, that prediction is expressed as a probability of each horse winning, so there is further work to be done to estimate odds versus the competition. In particular, we need to consider the probabilities of all the horses in the race, ensure these add to 100% and then convert to odds. A simple example would be a two horse race where a model says that each horse has a 0.75 chance of winning. Each horse would essentially end up being priced at Even money in the context of the race, and that’s what our oddsline will tell us. The same would be true of a model which gave each horse a 0.1 (ie.10%) chance of winning. Still Evens for both. The odds will be an accurate conversion of the model’s prediction in both cases, but something seems wrong with throwing the raw probability away, doesn’t it? Furthermore, do we rate the chances of a horse with an Evens chance in a two horse race in the same way as the chance of an Evens chance in a 10 horse race? Again, something seems wrong about ignoring this – the Evens chance in the 10 horse race has as much chance as 9 other runners combined, whereas the Evens chance in a 2 horse race is only 50/50 to win. These are just two ideas to explore further in backtesting.
With this in mind, let’s revisit the All Weather model again with some of the unexplored concepts in mind, and a focus on precise probabilities rather than ranking alone.
Recall from the last article, that even backing blind – as in having a bet in every single all weather flat race since the model was created in 2023 – was producing a profit for Betfair early prices when using the top and second ranked selections, but not at SP.
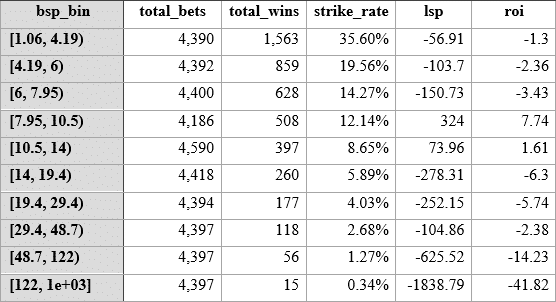
Any profitability in the market from backing every top selection is great indication of the potential of the model. However, using predicted rank alone is also blunt tool, since we’ve discussed that a sophisticated oddsline produces relative probabilities or odds for winning, as does the market itself. So, the next backtesting nugget is to break down Betfair SP into 10 evenly sized (in terms of numbers of horses qualifying at those odds) ranges or bins:
So here is the Betfair SP range table:
If we group betwise odds into the same buckets, the split will not be as even, but we can then compare like with like. Here goes:
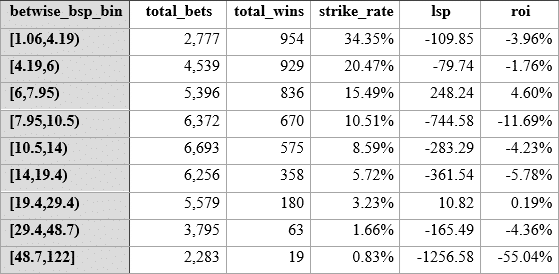
So, if we look at spotting value through using the best betwise odds range, it seems there is a little nugget staring at us in the range where betwise odds predicted are in the range 6 to 7.95 for this AW Flat model.
If the same odds range on Betfair were also profitable to level stakes, then we might say this is a fluke, but both the strike rate for this range (14.27 vs 15.29) is slightly better than Betfair, and the Betfair SP for horses in this group are showing a level stakes loss (- 150 vs + 248). On top of this, there is a larger number of horses in this range (5396 vs 4400) in the Betwise model, meaning the sample is very robust. Remember that we never used market odds in any way in the model.
Similarly, we never used the number of runners in the race. Let’s see how this breaks down using the odds range of the half the contenders towards the front of the market, so 1.06 to up to 14. We are looking to further bin all these contenders into a roughly equal division of field sizes, being small, medium and large. Due to the regular number of runners in all weather races, we can’t so easily create equal ranges, but these numbers are roughly 3 – 8 runners inclusive, 9 and 10 runners, and 11 runners plus, but more heavily skewed towards low runners as the numbers show. First the raw stats:
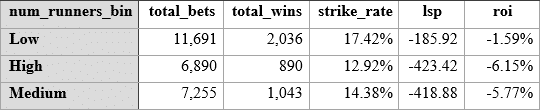
So, across a large odds range (we would in effect be backing half the market blind), of course we do not see any profits, but we do see that the number of runners have a predictive power – the strike rates, as we might expect – are higher for lower numbers of runners. Can we use this to our advantage if we also look at value? Here’s the same stats but filtered by Betfair SP being bigger than the predicted betwise odds (in other words, value bets only):
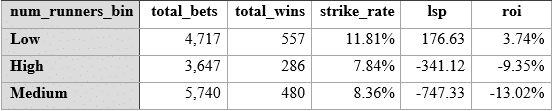
So, whilst the strike rate goes down, the value bet criteria applied to fields < 9 runners takes our profit up to + 176, with a 3.74% ROI. By the way, all P&L figures already factor in – 2% BF commission.
Let’s do the same thing with the highest probabilities (going back to the fact that the odds are based on relative probability in a race between the various contenders). Bearing in mind that the absolute probability is an output of the model and was never used before, we can see if it has some extra value in backtesting. Here is how the absolute probability BSP ranges (< 14.0 decimal odds):
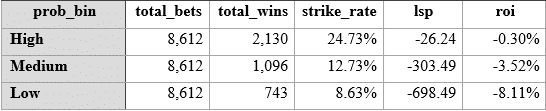
Note that the range of probabilities is a lot finer grained than number of runners, so the first point to note is that we have exactly the same number of runners (or bets) for each bin. And then a high correlation between the highest probabilities and the highest strike rate. Still unprofitable if backing 8612 horses in the top bin blind, but that is to be expected! How do things change if we only look at value (i.e. Betfair odds > betwise predictions) again:
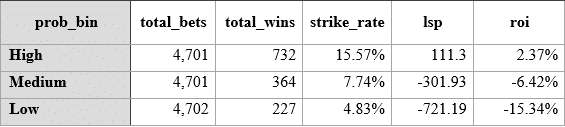
A fairly skinny ROI at 2.37% and a lower strike rate at 15.57%, but a decent level stakes profit after commission of + 111 points, bearing in mind also that these odds are taken at Betfair starting price.
In case you were wondering, the strike rate jumps up dramatically if we consider instances in using the lowest number of runners in a race coupled with the Betfair odds being less than the betwise odds. Effectively, the market is saying this horse has a stronger chance than the model thinks it has, and sure enough the market is right. By using this combination, we can significantly improve strike rate – but profitability inevitably suffers, at least in the broad odds range of all prices up to 14.0. However, in the right odds range, this can also be a powerful weapon, and profitability can improve dramatically.
Even a mediocre model can give you a good idea of which horses are not following the form. Think about it. If a horse is being planned for a betting coup, particularly in a low grade handicap, the best odds possible are not going to be obtained if the form is stunning going into the race. It stands to reason that when a horse is much shorter in the betting than in the oddsline, then someone knows something that is not evident in the form. Or they think that they know something that is not evident in the form! Either way, it’s worth looking at twice. The market is a brilliant guide, but it is the oddsline that exposes such an insight.
It’s why it is a tool and not the end game. Some models do indeed end up being profitable on their own, but that profitability can be short lived. The strike rate on a good model tends to remain consistent, however.
For the icing on the cake, let’s look at the odds range where the betwise model does best – 6.0 to 7.95, also binned further by being selective on the highest odds ranges or the lowest numbers of runners.
First Betwise value bets versus BSP binned by probability.
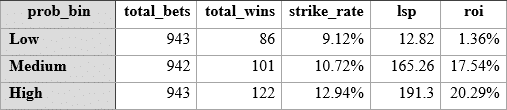
Highest probabilities show the highest strike rate, with the lowest range still producing a profit but at high risk with only a 1.35% return on ROI. We could get rid of this range and increase our strike rate to c. 11% with an excellent ROI of c. 19% and an LSP after commission of c. 356 points.
Now Betwise value bets versus BSP binned by number of runners in race.
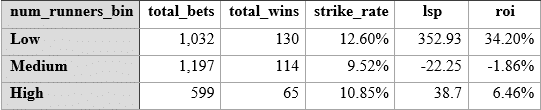
The bins are not even, due to the difficulty of slicing up the number of runners, which makes a strict comparison tricky, but it’s obvious that up to 9 runners, we could afford to focus purely on this cohort of races and significantly improve on the ROI for backing everything in the range 6 – 7.95 where the betwise odds are below BSP. For 352 points and a 34% ROI.
In conclusion, while setting up and backtesting an oddsline can be tedious, the insights gained can be both eye-opening and highly profitable. Our exploration of the All Weather Oddsline shows that selectively backing horses within certain odds ranges—specifically, those priced between 6.0 and 7.95—yields a noticeable edge, especially in smaller fields with up to 9 runners and in all fields where the raw model probabilities are highest.
By refining our focus on value bets and taking advantage of discrepancies between predicted and market odds, we’ve identified clear opportunities for profit. However, the real value lies in using the model to reveal the unexpected. Whether spotting a betting coup or simply leveraging probabilities in certain niches better than the market, backtesting using data that exists outside model inputs is crucial for optimising returns.
Colin Magee