
Hidden Handicap Value?
My challenge here was to see if there was a system to be had in Handicap races where the horse had not placed in its previous race. The thinking being that perhaps there could be a bit of value about its price given that it was not in the frame last time out.
I’m going to work with UK Flat racing for the purposes of this and of course Handicaps only.
I’ll look at five years of data 2019-2023 leaving out this year’s which we will take a look at afterwards to see if it would have been profitable this season.
Our initial filters are:
- Country: UK
- Race Code: Flat
- Handicap Races Only
- Horse did not place last time out.
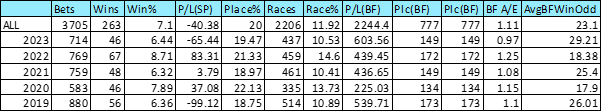
This initial dataset gives us the following results
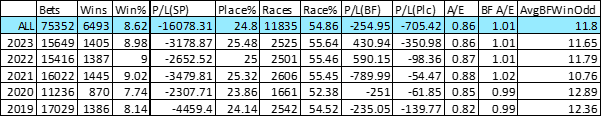
All in all, not a bad starting point. Two years (2023 and 2024) ended in profit to BFSP. No doubt in part due to some big price wins though. The strike rate is very consistent across the five years with a low of 7.74% and a high of 9.02%. A/E is pretty steady ranging from 0.82 to 0.87 at Industry SP and a healthy 0.99 to 1.02 on BFSP.
Let’s start by taking a look at their second last run. The thinking being if they were out of the frame then as well, they are that little bit more likely to be overlooked in the betting market by some.

This is fairly interesting as there’s not a huge difference in strike rate, 7.86% to 10.60% between placing and not placing and those that didn’t place even made a BFSP profit, again those big winners coming into play. The average BF win odds are a very healthy 13.26 while the strike rate suggests odds of 12.72 would be required to break even. Hence the BFSP profit. We’ll add in the not placed 2nd last run.
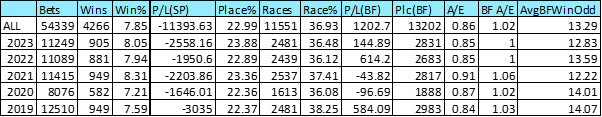
The difference in over all figures to the 2nd last run figures (54339 bets to 54067) will be down to those horses that are yet to have two runs.
Our BF A/E’s now range from 1 to 1.06 and it’s an overall profit at BFSP now although years have varied in increased or decreased profit. Another interesting thing to note at this point is that although there have been 54339 bets these have come in only 11551 races so currently, we have an average of around 5 bets per race. Could be food for thought on a dutching angle?
As we are trying to find some value here let’s take what might be perceived in the market as another negative for the horse’s chances and look at those where there Official Rating has gone up despite not placing in the last two races. It suggests the horse is improving perhaps without really being noticed by its results or indeed is a runner with a just a run or two under its belt and yet to prove anything.
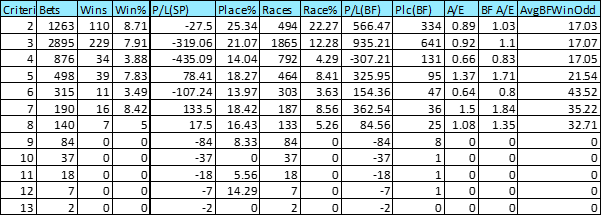
Here’s our new data with the added filter of a higher OR than their last race.
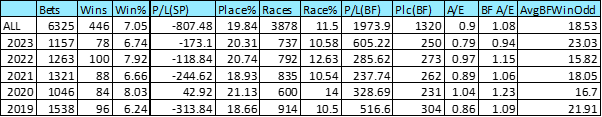
Our strike rate has managed to keep just above 7% and we now have an average BFSP win price of 18.53 whilst our BF A/E is holding up well with all bar one season over 1. The bet totals are now down to a much more manageable number and working out at an average of less than 2 bets per race as well.
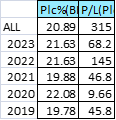
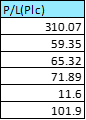
What we also now have is a very interesting place profit, using BF place SP, with all years showing a profit and consistent strike rates ranging from 19.78% to 22.08%.
As it stands at this moment the low strike rate would certainly not be for most as it will have a lot of very long losing runs, the longest of which on this dataset stands at an eye watering 130 (next longest 78) the excel calculation suggests a losing run of 119 is to be expected at the strike rate. With our place strike rate of 20.89% the expected losing run is 37. In this data the longest has been 34.
As an example of the kind of things you could expect at BFSP our worst month would see a loss of 138.89pts! Presumably, that month had if not all then the bulk of those 119 consecutive losers. The best month saw a rather tidy profit of 461.23pts. The average comes out at a very nice 48.14pts profit but whether you’d be able to stomach big dents in your bank waiting on the big wins is another matter entirely when it is real money going down. So, with that in mind, let’s see if we can refine things further.
Let’s start by seeing if we can bump the strike rate up a bit. We’ll take a look at horse age. Maybe those seasoned campaigners are on the way down rather than up or caught in the grip of the handicapper.
I think it’s clear to see that we would be wasting our time with horses 9 years or older. There were 148 runners over the 5 years without a single winner. I think I’d also be inclined to remove 8 year olds as well
A quick look at distances shows that the profit is coming from 5f to 1m races, so let’s concentrate our efforts there.

This leaves these figures.
A few stats on that:
Wins:
Expected longest losing run 107: Longest in data: 85 (next worst 55)
Places:
Expected longest losing run 37: Longest in data: 35 (next worst 28)
Every year is now in profit to BFSP and 3 of the 5 years are even in profit at ISP
Betfair Place SP is also in profit for every year
A quick glance at the data by month shows October as a striking outlier as the only month with a loss over the five years. And a further check sees that it has made a loss in every one of the five years of the data. This could be due to a number of reasons. Starts and ends of seasons are notoriously difficult to profit in.
I think it is a reasonable enough decision to have September as the final month. It could perhaps be in danger of falling into back fitting but being as it’s the season end, not some month in the middle of the season, it’s showing a loss for every single year and has just 14 wins from 256 bets (5.47%) then for me there’s enough in that to drop it.
This leaves us here.
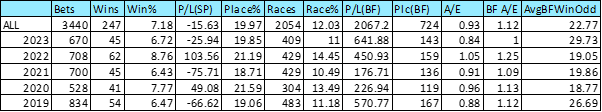
Longest losing runs remain at 85(win) and 35(place) and we are getting an average of 1.37 qualifiers per race.
I think it stands to reason that we want to try and avoid tough races due to the kind of average winning odds we are getting. If the race is stacked with horses that are coming off a win, then one of them is likely to get home first again.
Number of horses in race who won their previous race:
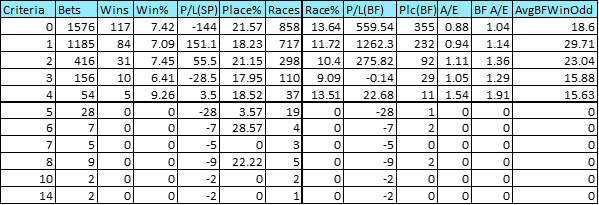
And there we have it. 53 races with 5 or more previous race winners in it have yielded no wins
We’re in a pretty good place now but still with this low strike rate. Profit potential appears excellent but real world betting with long losing runs is very hard to stomach and to have faith that the bigger winners will continue when it comes down to losing actual money and not just numbers on a spreadsheet test.
Let’s now take a look at the distance they were beaten in their last race. Do those who were well beaten last time fare worse in this follow up race?
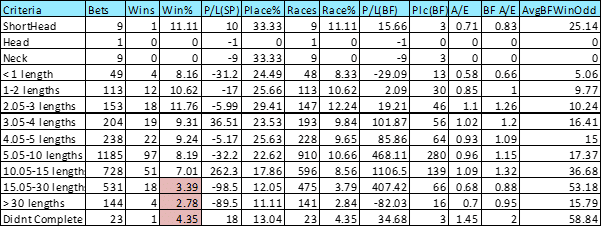
As we can see above those finishing more than 15 lengths adrift of the winner have a significantly lower strike rate with just 23 wins between them across 698 bets. We are losing a big chunk of profit here as there appears to have been at least one very big winner in those 23 but we are looking to reduce losing runs by upping our strike rate so we will remove them.
We now have a strike rate of 8.3% on wins and a 22.25% strike rate on places.
- Wins:
- Expected longest losing run 95: Longest in data: 64 (next worst 43)
- Places:
- Expected longest losing run 33: Longest in date: 25 (next worst 24)
- As an aside the Ave ISP win odds are just 12.95 compared to the BF 20.24 here.
- UK
- Race Code: Flat
- Race Distance: 5f and 1m (inclusive)
- Handicap races only
- Years 2019-2023 (inclusive)
- No. H-Won (Last Race) Between 0 And 4
- Horse: 2 to 7 (inclusive)
- Compare v LR Official Rating – Higher
- (LR) Placed? No
- (2LR) Placed? No
- (LR) Distance Beaten NOT over 15 lengths
I think we are now at a point where any further filters would probably not be logical one’s and just an exercise in back fitting. Each year’s profit will largely depend on the size and number of those outsider wins.
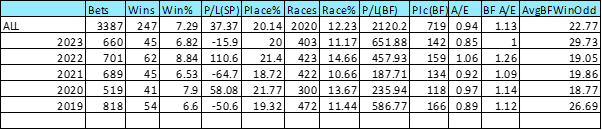
So, let’s see what 2024 to date would have thrown up with this criterion and take a bit of a dive into it as if we had gone live with it.
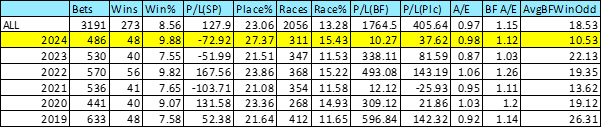
The first thing of note is that we are in profit. Only just but a profit is a profit. It’s on a par to the 2021 season that had 12.12pts profit. What is interesting is that the average BF win odds are the lowest yet again similar to 2021 which highlights again the fact that win profit will very much depend on catching those big priced winners.
What’s good though is even with that Average win odds being just half of our best years we still ended up without losing any money. ROI still managed to come in at 2.11% as well.
Place profit was a very nice 37.62 pts to BF Place SP.
Here are this year’s monthly totals.
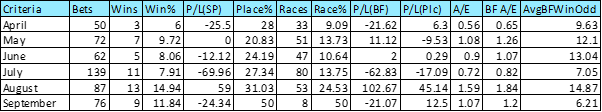
Had I been starting this live then April would undoubtedly have been a very tough start. May would have restored some confidence and June breaking even would have been ok. July, however, might have been the straw that broke the camel’s back.
Of course, as hindsight can see, throwing the towel in at that point would have been sickening to then see August’s 102 pts profit come in! September saw an end much like the start.
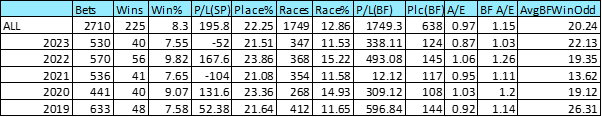
I’m particularly interested in the BF Place SP side of things though. One losing year across the six and over 400pts of profit at an ROI of 12.71%! in total.
2024 despite the tiny win profit, came in with 37.62pts of Place profit at a very healthy ROI of 7.74%
Some info from the 2024 results
- Largest BFSP Win: 27th August. 2:40 Musselburgh Hard Nut @ 80.00 (ISP: 51)
- Largest BF Place SP Win: 20th August 6:10 Nottingham Dark Sorceress @17.93
- Longest Losing Win Run: 30 (twice) (second longest 29)
- Longest Losing Place Run: 28 (second longest 18)
I think the 2024 data has given a perfect example of what following a system like this will bring. An emotional rollercoaster with your bank and when it’s real money probably a constant nagging doubt that those winners may never actually arrive. Which, as the small print on those investment adverts try not to mention, there is no guarantee that they will.
In summary, the consistency of the strike rates and A/E’s give me some encouragement that there just might be something in this as a background small stakes system with a chance of a nice reward. I’m going to follow this when it starts up again in April and I will be particularly interested in how the Place SP fares.
Matt Russell