Trainer performance with first run after horse switches stables.
It has been a long time (around 10 years) since I dug into data where I examine trainer performance with flat runners who have switched stables and are having his/her first run for a different trainer. The question is – what effect does a change of stables have on this first run for a new trainer?
I have gathered data for flat racing for 10 full years from 2013 to 2022.
I have calculated profit and loss to Betfair SP (BSP for short).
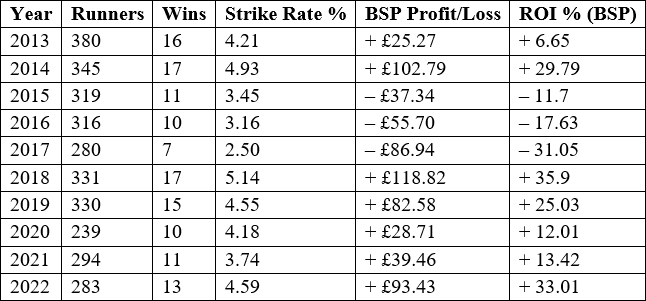
Here are the overall figures.

As you can see, a change of stables is not a blueprint for a high winning percentage.
Less than one horse in every 12 manages to be successful. Losses are minimal, but as we know with BSP, a few huge priced winners can skew the figures. Having said that, when I looked at the record of horses priced at BSP of bigger than 40.0, this is what I found:

Significant losses here – normally the odd freak 300/1 or bigger priced winner skews these big prices into profit despite the very low win chance. However, not this time around.
It makes sense therefore, having seen these figures that we look at the BSP prices in more detail.
I have decided to split the remaining runners into four price brackets:

Here are my findings:
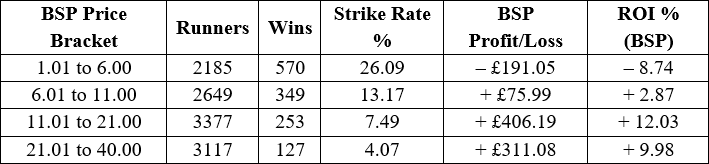
The shortest priced runners have made a smallish loss, the rest have been profitable.
Now the strike rates as the price increases are low, so backing runners would be a risky strategy. However, I am still surprised to see such positive returns. I am also surprised when I look at the yearly breakdown for both the 11.01 to 21.00 price bracket and the 21.01 to 40.00 price bracket:
11.01 to 21.00 price bracket
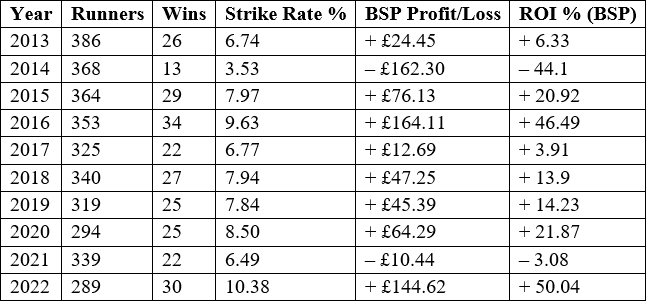
Eight winning years out of ten, and only 2014 was a shocker losing 44p in the £.
This 2014 year is where alarm bells do ring, but overall yearly performance has been good and consistent when viewed over these ten years.
21.01 to 40.00 price bracket
This bigger price bracket has still seen seven winning years out of ten – of course 2015 to 2017 were three losing years in a row, so before punters rush to back such horses, we need to appreciate that yearly profits are not a given.
PUNTER WARNING
I should mention that if I go further back and look at data from 2008 to 2012 these two price brackets both made a loss in this 5-year period. AND there were just 2 winning years for prices 11.01 to 21.00, and only one winning year for prices 21.01 to 40.00.
As I mentioned earlier backing such runners will always carry a good deal of risk.
Time to look at other angles now:
Age – let us see if the age of the horse in question makes any difference:
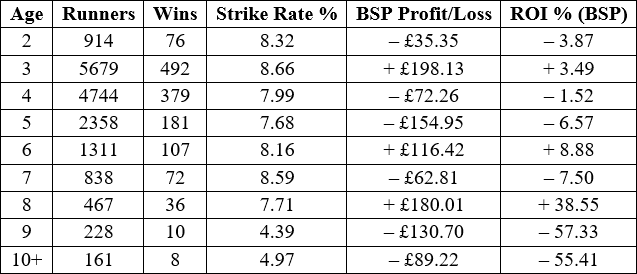
Similar strike rates from horses aged 2 through to 8. The odd age group in profit, but this is down to the big priced winners occurring for these specific ages.
The strike rate drops off at aged 9 and these horses definitely look worth avoiding. It seems that for horses aged 2 to 8 the exact age is not that important.
Market rank – Moving away from age, let us go back to the overall figures and breakdown the results by market position. We have looked at price brackets earlier – here we drill down into specific market positions:
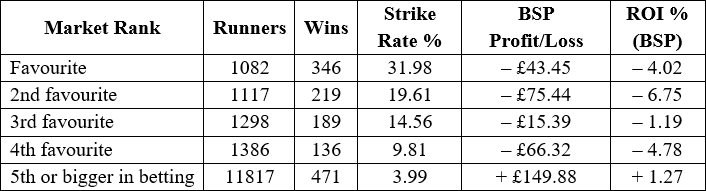
Looking at the return’s column (ROI%) the figures do not vary that much. Bigger priced runners have edged a profit but that was to be expected given what we saw earlier with the price bracket data. Favourites score 32% of the time, and although they have made a small loss, this may be a group I will personally look into more detail in the coming weeks.
Days since last run – onto fitness now.
Does a relatively recent run help or not? My thoughts before seeing the data are that I expect horses with the longest absence to perform the worst. Partly because that long absences generally produce lower strike rates, but also because I thought a longer break from racing may indicate some kind of problem for the horse.
Let us see:
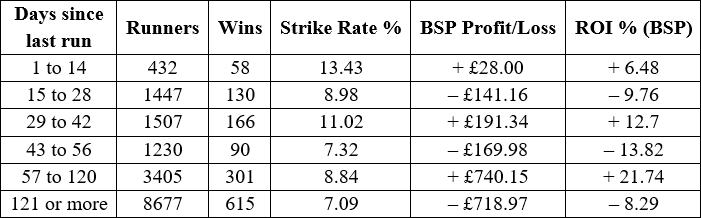
The strike rate is better for horses running within six weeks (42 days or less) compared with those off the track for more than six weeks. This is to be expected.
The horses off the track for the longest (roughly 4 months or more) have under-performed compared with the rest as I had suspected they would.
Lowest strike rate and relatively poor returns.
Trainers – let us look at arguably the most important area – the trainers who are training these horses and seeing them run for the first time. To qualify for this table each trainer needs to have had a minimum of 60 runners and secured a strike rate in excess of 12%. I have ordered them by strike rate:
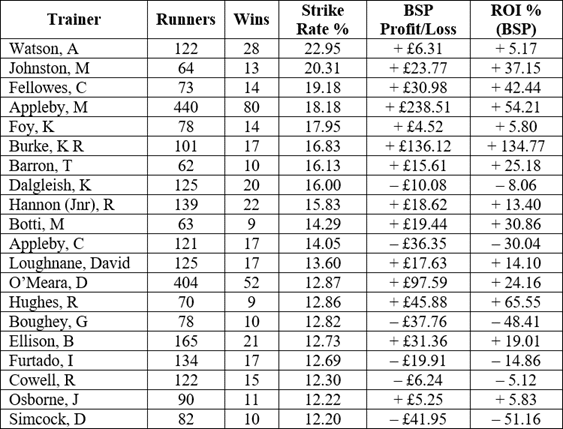
The vast majority of these trainers have turned a profit which is interesting, and I want to drill down into one trainer in particular.
Michael Appleby – over 400 horses have been switched to Appleby in the past ten seasons which suggests owners have done their research. Appleby has been pretty consistent with these stable switchers producing a profit in eight of the ten years.
Appleby has done amazingly well with horses that finished in the first three last time out for their previous trainer.
Of these 105 runners, 28 have won (SR 26.7%) for a huge profit of £92.74 (ROI
+123.0%).
Once again, he has been consistent across the years with eight winning years out of the ten.
I want to mention one horse that switched to Appleby at the end of 2022. The horse in question was Zealot.
Before Appleby, the horse had been trained by Eve Johnson Houghton for its previous three starts having switched from Joseph Tuite, where the horse had had its first four career starts.
In the seven runs before going to Appleby the horse had won once, been placed once, and finished out of the places on five occasions. His first run for Appleby was on 16th December 2022 where he finished 3rd. Since then (at the time of writing up to 20th
March), the horse has been very busy racing a further eight times. He has won seven of these!
The switch in stables has worked pretty well for him.
System 16: Follow the Mick Appleby runners when running for the first time for the trainer when they finished in the top 3 places last time out.
Now this article has been focused just on that first run for a new stable and that gives us a small window of data to examine. As with any basic idea, there is always a huge amount of scope to go further and dig deeper. However, except for that extra Appleby nugget, which is beyond the scope of an article of this length I’m afraid.
Before I finish, it is worth sharing trainers that have a poor record with stable switchers on their first run for them:
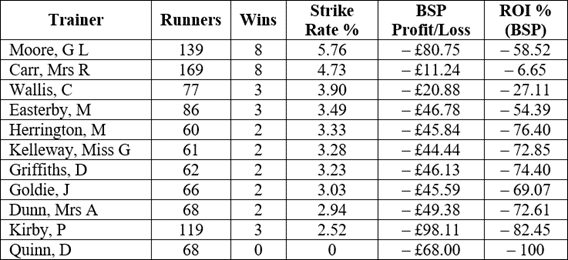
It looks best to avoid these trainers when you see a horse having their first run for them having just moved stables.
Good luck if you look out for stable switchers in the future. I’ll be interested to hear whether this article helps you over the longer term – hopefully it will.
David Renham
Featured Image: (CC BY 4.0) – Totterdown | Adlestrop, November 2022. | Carine06 | Flickr