New Angles for Jockey Performance Analysis
One of the best aspects of working with a programmatic horseracing database like Smartform is the near-infinite scope it offers for analysis. With data spanning decades and hundreds of variables available, you can explore niche areas of performance for any combination of data that you can dream up.
However, for those short on time, the possibility to do anything with the data and the requirement to program to get the best results can also be a drawback.
That’s why we’ve been developing a growing number of targeted tables that streamline the process. These tables not only save time but can provide new angles for exploring specific aspects of form. One such addition launched within the last month is the newly created jockey insights table.
Updated daily and covering 17 years of data – over 2 million rows of data in fact – it provides a detailed view of jockey performance that can be used to answer a wide range of questions with simple queries on a daily and historic basis. Inevitably, the view of which variables to create and include can be seen as somewhat opinionated, however bear in mind that it’s always possible to create any other variable with a little extra query building.
So, without further ado, let’s drill down to give you a taste of what can be done to explore jockey form from the most basic queries to more sophisticated ones.
Firstly, the table is built on a race by race and runner by runner basis, within each race.
In that context, a slew of jockey statistics for each rider in the race are calculated up to and including all races the day before the current race for different metrics – for example, course strike rate – and different time periods – for example the last 5 years, the last 21 days and so on. Different metrics or categories include features like strike rate for race type, specific handicap conditions, the ages of horses ridden and so on.
Since we can go “back in time” to any particular day in the past, we can also compare the statistics between different dates, or statistics retrieved under different conditions to today’s conditions. This enables comparison over time to see whether a jockey’s form under the same conditions is improving or deteriorating, as well as how a jockey performs under different conditions (for example, if the jockey is riding at Lingfield today, we can retrieve the latest data from any other course they have ridden out to get a comparison).
Arguably the data is best used when comparing performance statistics for all jockeys in any particular race, and we’ll come on to that shortly. To start with, let’s pick on one jockey to explore some of the angles. Hector Crouch is currently a leading contender for the All Weather Championships and will have plenty more rides to come before the season officially ends on April 18th, so we’ll use his performance statistics as an example.
A quick check in the table reveals his first ride was at Kempton in 2013, and there have been over 1900 rides since then. Firstly, the overall stats for the last 5 years racing on all weather surfaces (i.e… Performance by race type) is a standard metric in the table.
Note that each statistic includes wins, runs, strike rate and the percentage of rivals beaten (PRB). PRB can help when there are small samples for jockeys, so wins to runs ratios can be easily skewed, either positively or negatively, masking true performance.
This is not the case with Hector Crouch over the last 5 years. With almost a thousand rides over the last 5 years, Hector Crouch’s win rate is highly informative and reliable, but using PRB instead may come in handy with some of the smaller samples we will come across.
Ok, so an overall strike rate is our starting point, and we can compare this against every other jockey in the same race, but it is not a new angle.
So, the first question we’ll ask and answer is how does this strike rate break down for all the different all weather courses?
Despite the impressive strike rate overall, is Hector Crouch better at riding some tracks as opposed to others?
This time we’ll convert our query output to a horizontal bar chart – the numbers after each bar are the wins to runs ratio at that course, so we can check the sample sizes involved.
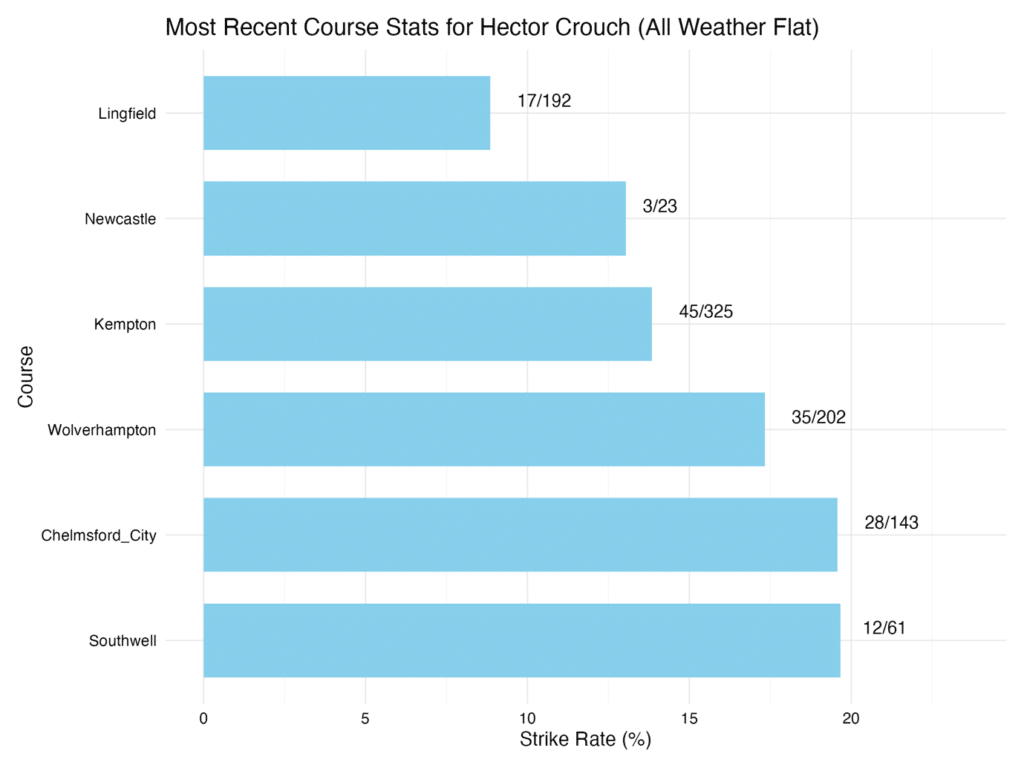
Our first insight: it seems we can answer that yes, Hector Crouch is better at riding some courses than others. At Wolverhampton, Chelmsford, and Southwell he’s at the top of his game, but not so much at Lingfield.
What about handicaps versus non-handicaps on the all weather? Again, this metric is tracked on a daily basis, so we can just query the raw values to produce the following plot in R:
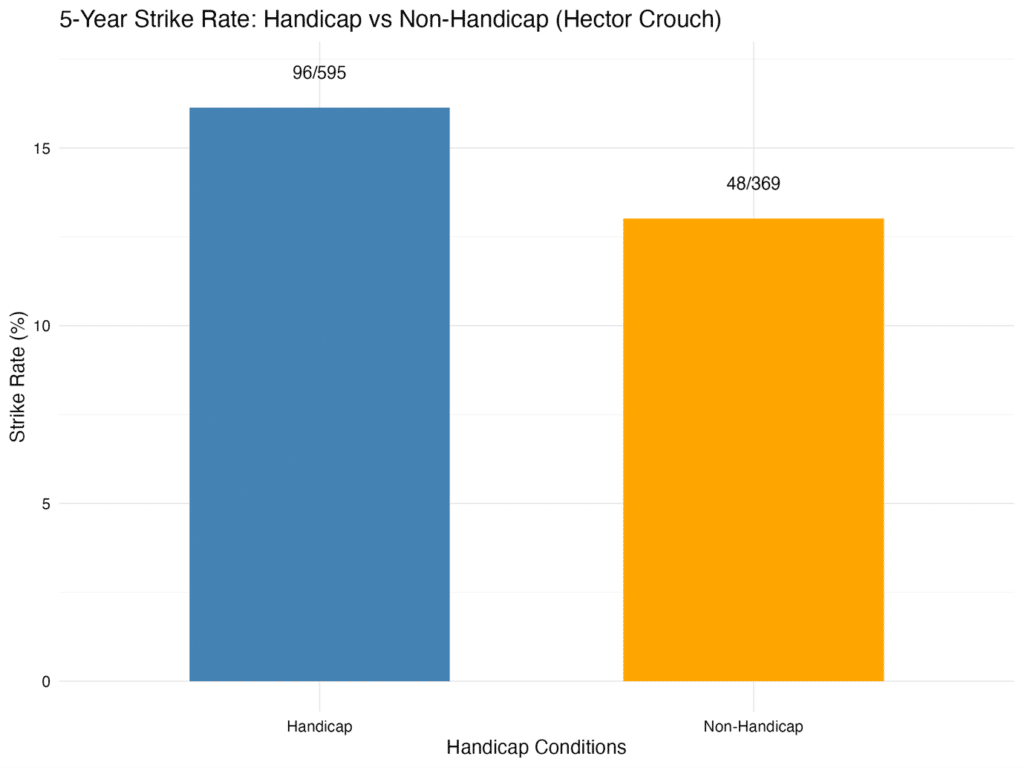
Given the large sample sizes this is again quite a significant shift against the baseline performance – a circa 5% higher win strike rate in handicaps versus non-handicaps.
We’ll next look at using a different set of metrics to strike rate for analysing performance by recency. We’ve included rolling 5 year averages for all categories, but also 42 day and 21 day strike rates to look at recent performance in particular.
By comparing the 5 year, 42 day and 21 day metrics we can get an idea of how well each jockey is performing against their baseline strike rate and whether form is improving or deteriorating.
In this case, using percentage rivals beaten can be a more accurate metric to use since the small samples for wins to runs over a period like 21 days can sometimes present a skewed picture of performance when comparing to longer periods that use more robust samples; in short, PRB presents a better like for like comparison over different time periods.
Here’s how the picture looks for Hector Crouch, again for All Weather racing only:
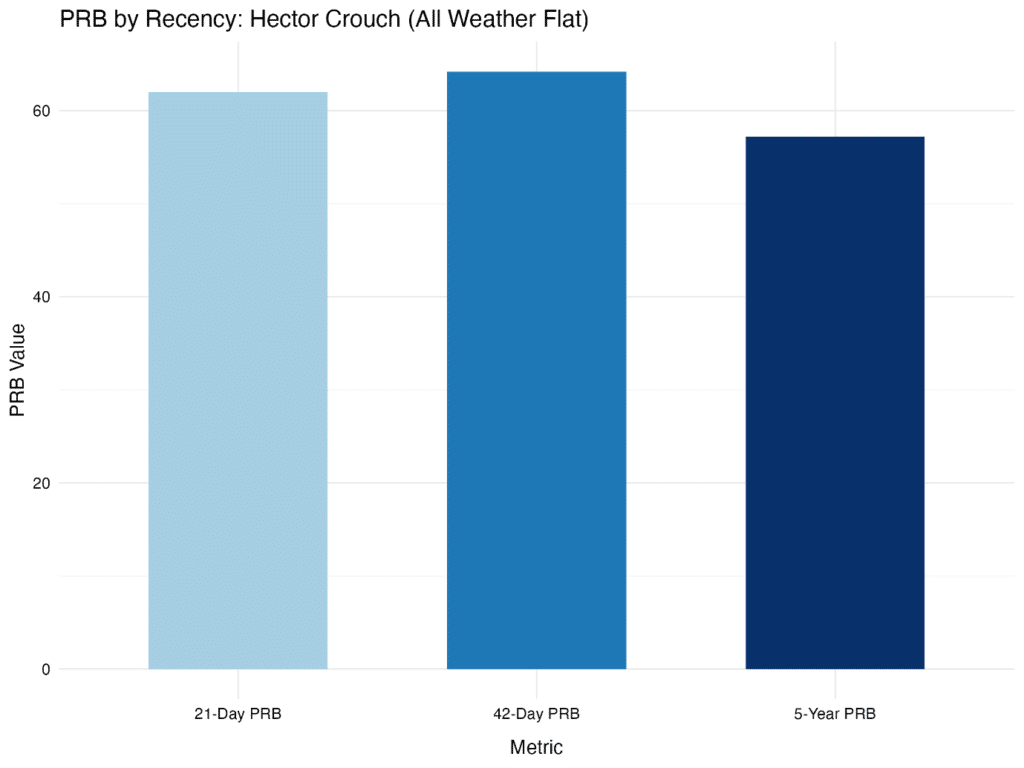
In this case, we can see that Hector Crouch is riding in great recent form compared to his long term performance. The PRB statistic has dropped slightly in the last 21 days but is still above the long term average.
We could continue to show many additional metrics for Hector Crouch – the different categories available are all in the table linked to at the start of the article – but what is arguably the most interesting feature is the ability to compare and combine these metrics to analyse the relative up to date performance of jockeys within any given race.
And that is exactly how the raw data in the new database table is presented, with all metrics available daily (up to but not including the current days’ racing) for every contender and jockey on a race by race basis. So, let’s now turn our attention to that.
The handicap versus non-handicap metric, which is already available by race type only, represents a robust sample over 5 years for most jockeys. Additionally, if we use PRB we can normalise the data further. The following plot therefore takes all the 5 Year PRB values such as we showed earlier for Hector Crouch, and plots them all against each other, with the red dashed line showing the highest comparative performance in the race, and the x axis automatically highlighting the horse (and jockey) with the highest score in bold.
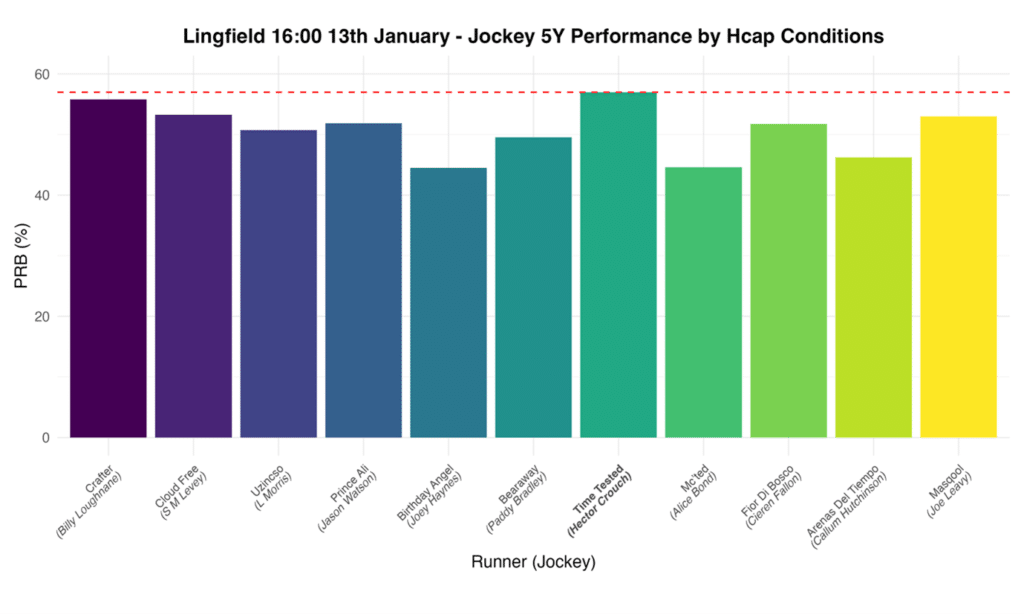
Not much in it, but Time Tested (i.e. Hector Crouch) comes out on top, and in fact won (writing this shortly after the race) at a decent price of 5/1. Had we used comparative course performance, this would not have been the case. However, the handicap condition by race type is proving to be a highly predictive variable when compared to other jockeys in the same race. We can also condition it further to add in any of the other variables, to create a weighted comparative rating by course performance and by recent form.
When combined with these other data points, even with the Lingfield stats weighing down Hector Crouch’s performance, we still see Time Tested come out well.
It’s also straightforward having done this for one race, to produce a series of race plots for each meeting, so you can tell at a glance which jockeys have an edge in terms of performance in any given race on a day. You can see how this analysis looks across all races in a given meeting in our previous blog post announcing the new database table, available on the Betwise site.
This, along with many other variations, is something you can easily produce for yourself with the new table.
Colin Magee