
Testing Sire Performance by Course
We recently published a new addition to Smartform – a new database table providing daily runner stats from 2008 according to the performance of their sires in every race – or, if you prefer, according to their siblings past and present – based on rolling performance stats up to, but not including the race in question.
The daily_sires_insights table includes over 40 such performance variables, and can be used to create models or systems based on past data, and for automatically selecting candidates that qualify in upcoming races.
In this article we’re going to do a deep dive on just one of these variables: rt_5Y_course_prb. This variable represents the rolling 5-year performance of each runner’s sire by race type, according to the aggregated percentage of rivals beaten by each sire’s runners at the course where each race takes place. Another way of looking at this is to say for any runner in any given race, this stat will rank the aggregate performance of all its siblings according to how many rivals they have beaten at the same course.
A recent blog post highlighted a simple use of the new statistics for assessing all runners in any upcoming race at one course using this one variable. Most stats are easier to comprehend in a graph I think, so here’s one that represents this variable for the race we highlighted in the blog post.
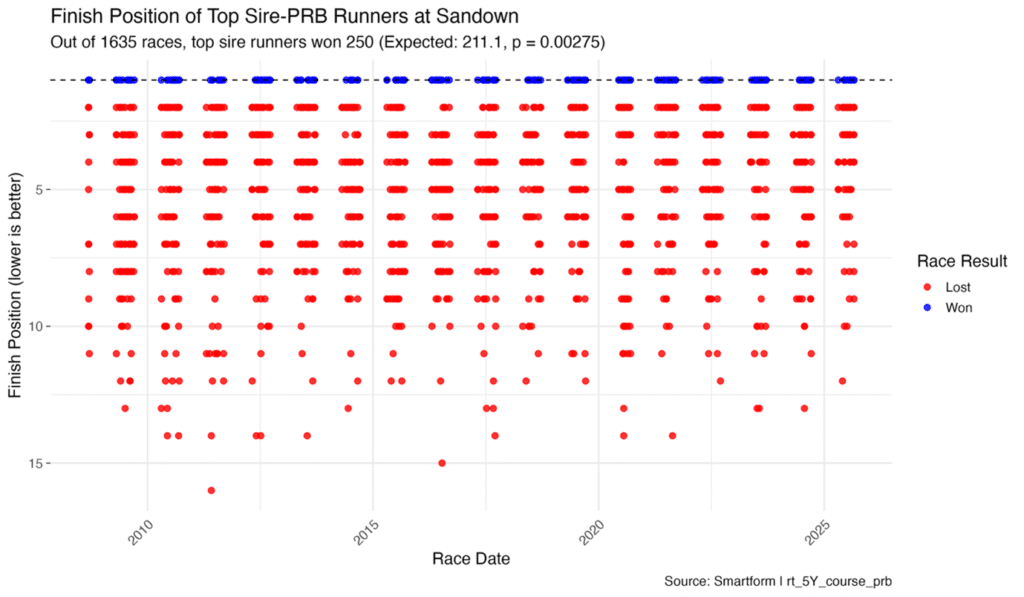
Finish positions are clearly skewed toward the front, with wins (in blue) clustering tightly around first place, but even for the losers many still finish well (e.g. 2nd–4th), showing that top sire-course PRB runners consistently perform strongly, even when not winning.
There’s no big drop-off or spike over time showing consistency in both win and loss distributions over the whole backtesting sample, indicating the Sire-course PRB model remains relevant over the years – at Sandown, at least.
Let’s delve a bit further into the stats and see how the win races break down between handicap and non-handicap races.

So, we’re looking at almost equivalent win rates, but the performance above expectation is higher in handicaps.
Impossible to say for sure without further analysis, but one reason for this could be that sire performances in stake races are perhaps more evenly matched (ie. a greater percentage of contenders are more likely bred for the job), so there is less differentiation between runners. Whatever the reason, it’s time now to look at whether the statistical significance translates into profitability.
Return on Investment (ROI)
So then to the critical question:
If you had backed every top sire PRB runner at Sandown to win at BSP, what would your ROI look like?

Decent – is the answer…
Have we potentially identified the system based equivalent of a golden goose? – ie a ranked variable with a consistent strike rate that produces a consistent ROI?
To answer that, let’s delve deeper into the ROI to see how it plays out over the large number of years in question. Is there indeed a consistent ROI by year?
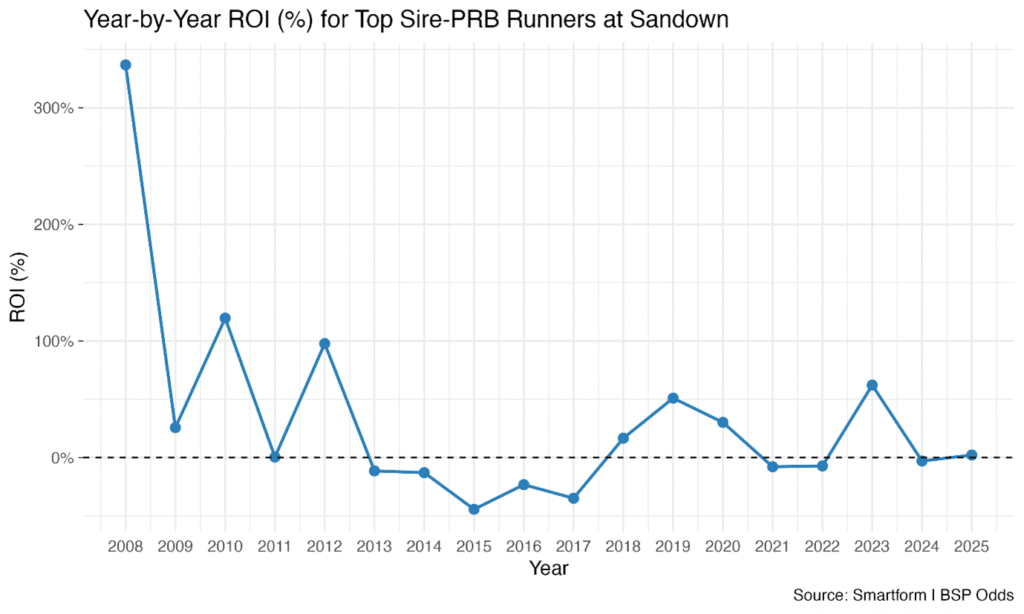
You’ll notice:
- Large spikes in 2008–2012, driven by a few huge-priced winners
- Mixed but mostly positive returns in the past 5 years
- Consistency: a minority of losing years
Handicap vs Non-Handicap ROI
Remember we saw earlier a higher statistical performance in terms of edge over random in handicaps? To explore the impacts on ROI, we split the dataset in the same way, according to profitability in handicaps vs non handicaps.
roi_by_handicap <- roi_data %>%
group_by(handicap) %>%
summarise(
bets = n(),
wins = sum(won),
return_pts = sum(ifelse(won == 1, bsp, 0)),
ROI = (return_pts – bets) / bets * 100
)

Insight: Sandown’s handicap races show clear ROI upside using sire-course PRB — but the returns are negative in non-handicaps.
Split ROI by Handicap and Year
Now we’ll run the same analysis year by year for all races, but split each profit line by its handicap status.
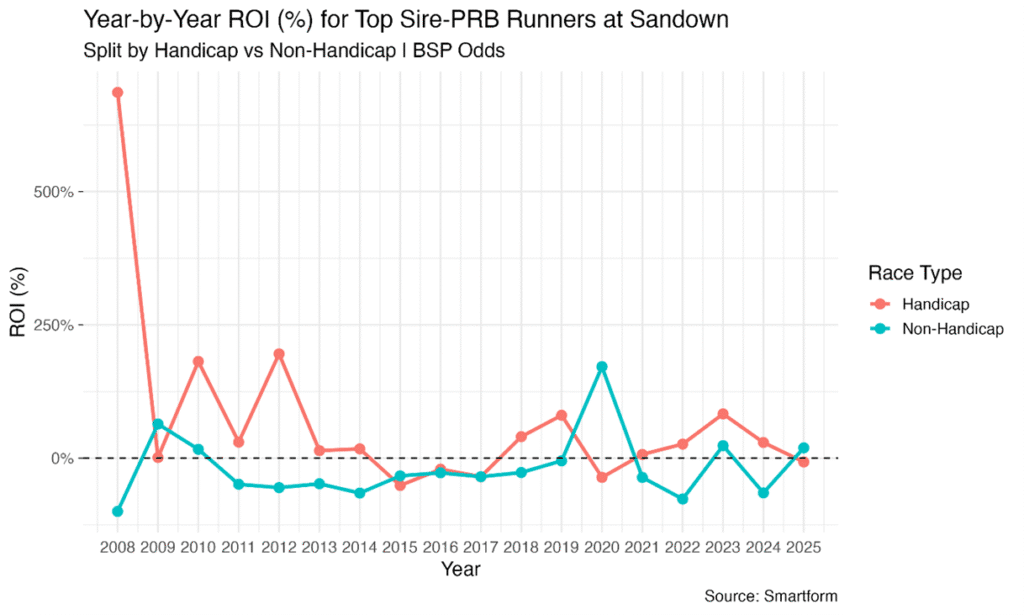
Our revised system concentrating on handicaps only is looking far more promising. Only 4 losing years in the 18 year period, with a 39% return overall. However, most of that return came in the early years. We can further validate this by looking at the profit distribution
Profit Distribution for Winners
Here’s a final look at the distribution of profit per bet for winning runners, separated by year and race type:
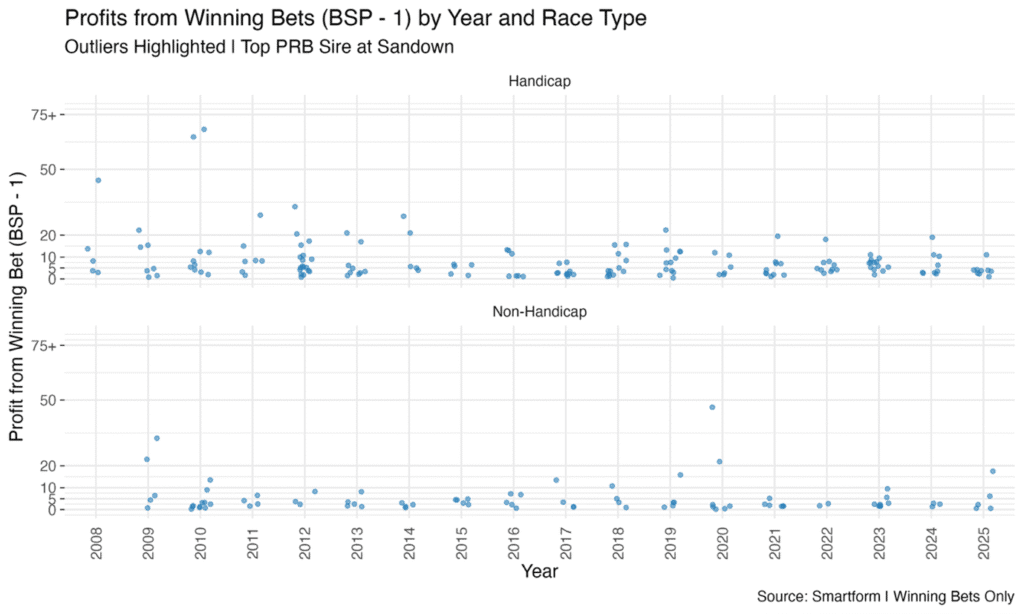
Most winning bets fall in the 2–10pt profit range, but every few years there’s a standout spike above 50.
Even using just one metric — a sire’s PRB performance at Sandown — we can observe:
- Statistical overperformance vs. expectation
- Positive ROI overall, especially in handicap races
- Distinct course effect that makes biological sense
This is a single-use case for the newly released daily_sires_insights table in Smartform. But it shows just how rich and flexible this data can be. It also shows there is really no such thing as a golden goose in betting, even when a metric like this shows extraordinary ROI potential over time. Few would sniff at 40% ROI on a level stakes basis, or 75% of years being profitable.
However, if you’d backed these selections blindly at Sandown between 2015 – 2017 inclusively, you’d have made a consistent loss in each of the three years.
Hopefully you’d have given up by 2018! But the edge is consistent, it’s a case of using it with other factors, including the prices available, and betting selectively rather than blindly.
We’ll plan to post a daily breakdown of sire performance by this metric for a course per day over on the Betwise website in the next month, if this is of further interest to readers — and of course, you can dig deeper into this data yourself by subscribing to Smartform, where the full daily_sires_insights table is available daily — ready for your own models, systems, or angles.
Colin Magee