Research Corner – Trainer Ratings
Hi All
For this month’s offering we will be returning to a “blast from the past” in the form of the Adrian Massey portal.
Back in the early 2000’s these Horse Racing pages offered up a wealth off useful information which included unique horse ratings which offered bags of potential to develop a systematic approach.
Although the horse ratings are no longer part of the sites content there is still plenty of useful data including comprehensive data on the trainers, and it is that aspect that we will be using as a starting point.
The following is straight from the horse’s mouth so to speak…
Trainer Ratings
It is well known that some trainers train a lot more winners than others. That might be because they are better trainers, but it might be because they have more horses, or better horses, than the other trainers. Some trainers have many followers, so their horses, tend to have SPs which are shorter than they otherwise would be.
Likewise, some trainers have few followers so their horses tend to have SPs which are longer than they otherwise would be.
What is important for the backer (or layer) is to know whether the horses of a particular trainer perform better or worse than expected according to the SPs of the horses. For example, do the 10-1 shots of Trainer A tend to perform better or worse than those of Trainer B.
These ratings are an attempt to indicate which trainers are better or worse than average, taking into account the SPs of the horses that they train.
The ratings are calculated as follows: –
Firstly, by analysing a lot of races, the AM site has calculated the average finishing position of horses at all different values of SP.
The finishing positions are expressed in 3 different ways: –
Win Percentage: For example, Horses with a SP of 3-1 on average may win 23% of the time.
Place Percentage: For example, Horses with a SP of 6-4 on average may be placed 62% of the time.
Percentage of Other Horses Beaten: For example, in an 11 runner race, the winner has beaten 100% of the other horses; the horse on last place has beaten 0% of the other horses, while the horse in 6th place has beaten 50% of the other horses (5 in front and 5 behind).
It may be those horses with a SP of 2-1 beat 78% of the other horses on average while horses at 10-1 beat 37%.
Secondly, the finishing position of each of a particular trainer's horses are compared to the average for horses at that SP. Taking an average of these comparisons gives a rating for the trainer.
A rating greater than 100 indicates that the trainer whose horses tend to finish in a better position than average, while a rating less than 100 indicates the opposite.
Trainers with higher ratings should give better value to the backer.
The following shows the yards with the highest Trainer Rating based on the previous 12 months, as at 14th July 2021.
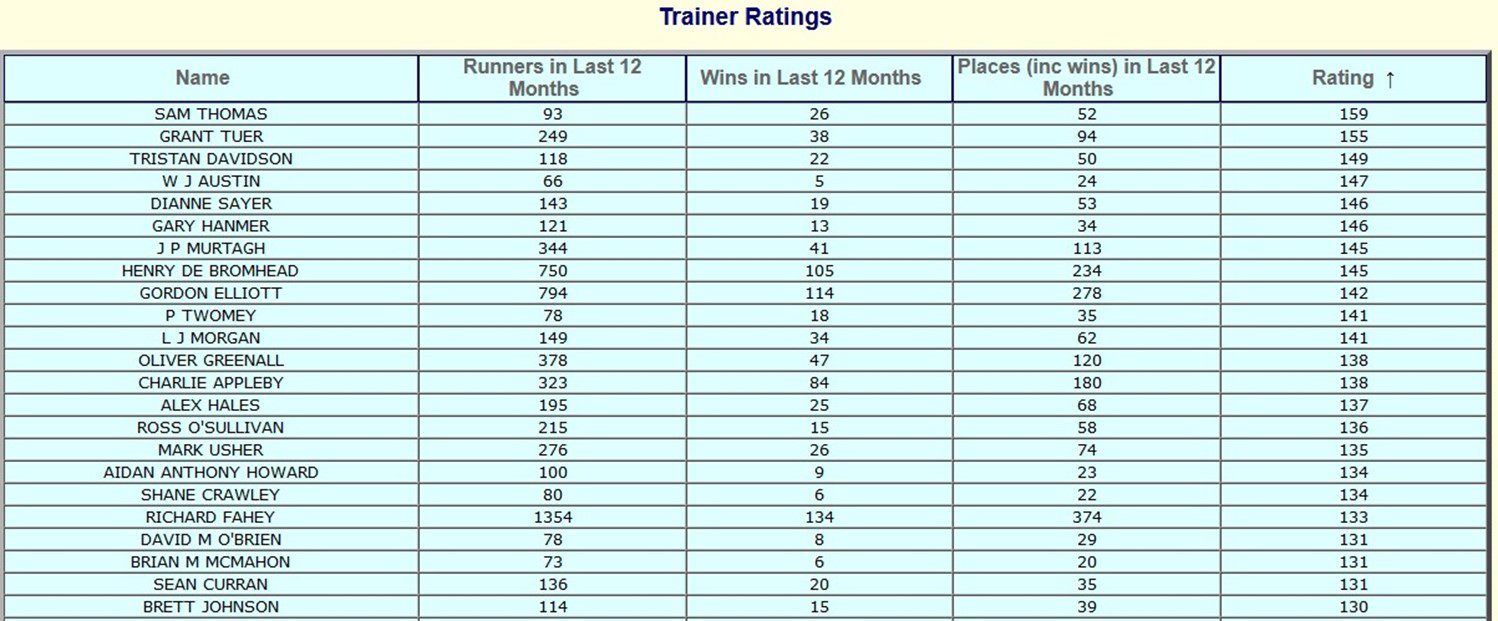
Starting from the top rated we have selected four trainers that had at least 200 or more runners during the latest 12 months along with a decent winning strike rate.
The ones chosen are Grant Tuer, J P Murtagh, Oliver Greenall and Charlie Appleby and between them they will provide action across both the Flat and National Hunt calendar as well as venturing over to the Irish scene in the case of Johnny Murtagh.
Backing these trainers’ entries almost guarantees you are making a value bet but let’s have a closer look to see how we can increase profits.
Grant Tuer
Based at Wiske House Farm Stables in Birkby, North Yorkshire Grant Tuer may not be a familiar name but as you can see from the Adrian Massey Trainer Ratings his runners over the latest 12 months have been outperforming the market expectations based on the returned industry Starting Price.
A quick run through in horseracebase shows 250 runners over the last 365 days.
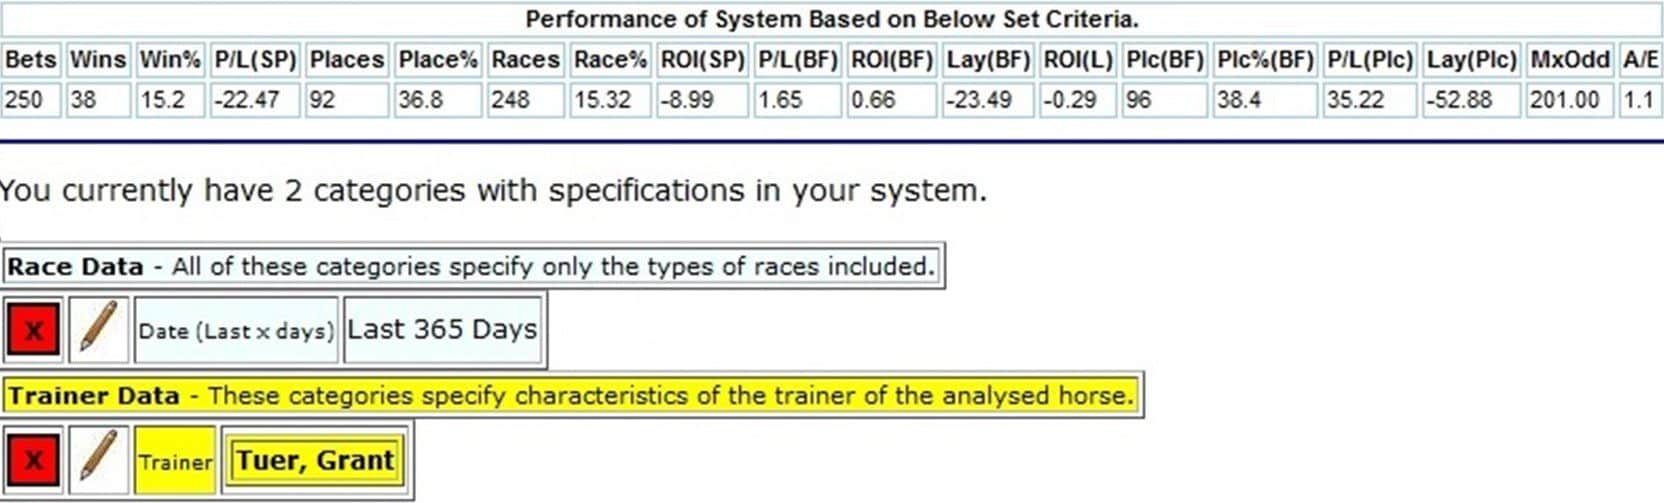
At this stage you may notice the numbers are slightly different as whilst we are compiling the analysis the yards continue to have runners.
First off, our eyes are drawn to the “A/E” figure of 1.10 which straight away re-confirms that the yard is indeed outperforming the market expectation as 1.00 is the par and anything higher is a positive trait.
Blindly backing every runner Grant Tuer sent to the track over the last 12 months would have made a tiny profit at the Betfair SP but hopefully we can improve on that with a closer check.

There is a significant difference between the performance of the runners on Turf when compared to those at the All Weather tracks.
If we then drill down a little on the Turf runners, we find the following: –

Clearly the runners in Handicap races are the ones to home in on.
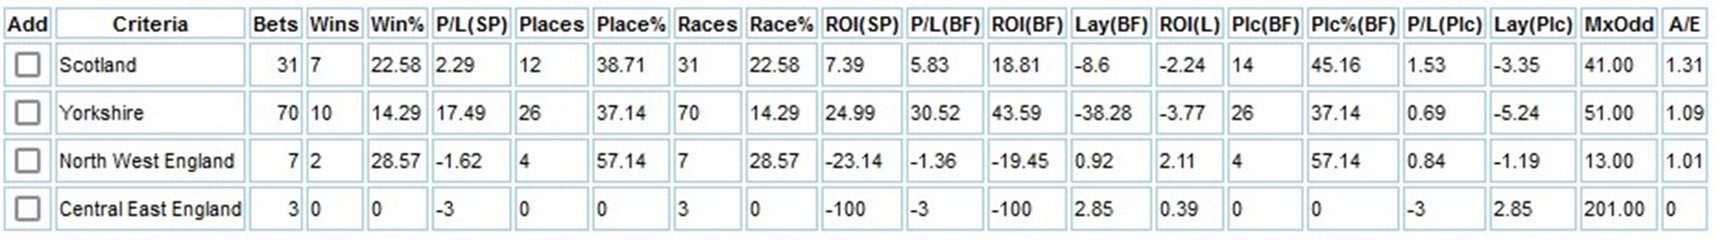
The above table shows that the entries close to the yard’s location and further north have been the most fruitful.
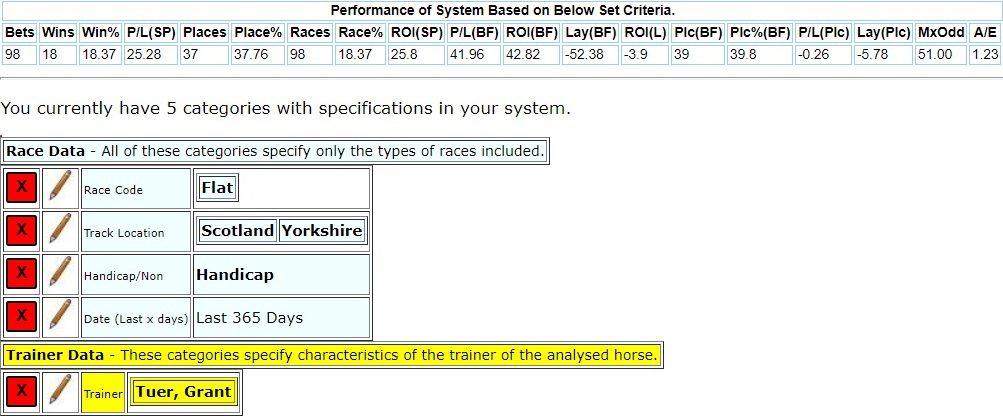
System 20: Back Grant Tuer Handicap Flat runners when running in Scotland or Yorkshire based tracks.
For Gold readers we take a close look at our three remaining trainers and drill down and find some huge ROI’s that will hopefully deliver big profit for us in the coming months – if you’d like to upgrade to Gold you can do that here https://www.oncourseprofits.com/upgrade
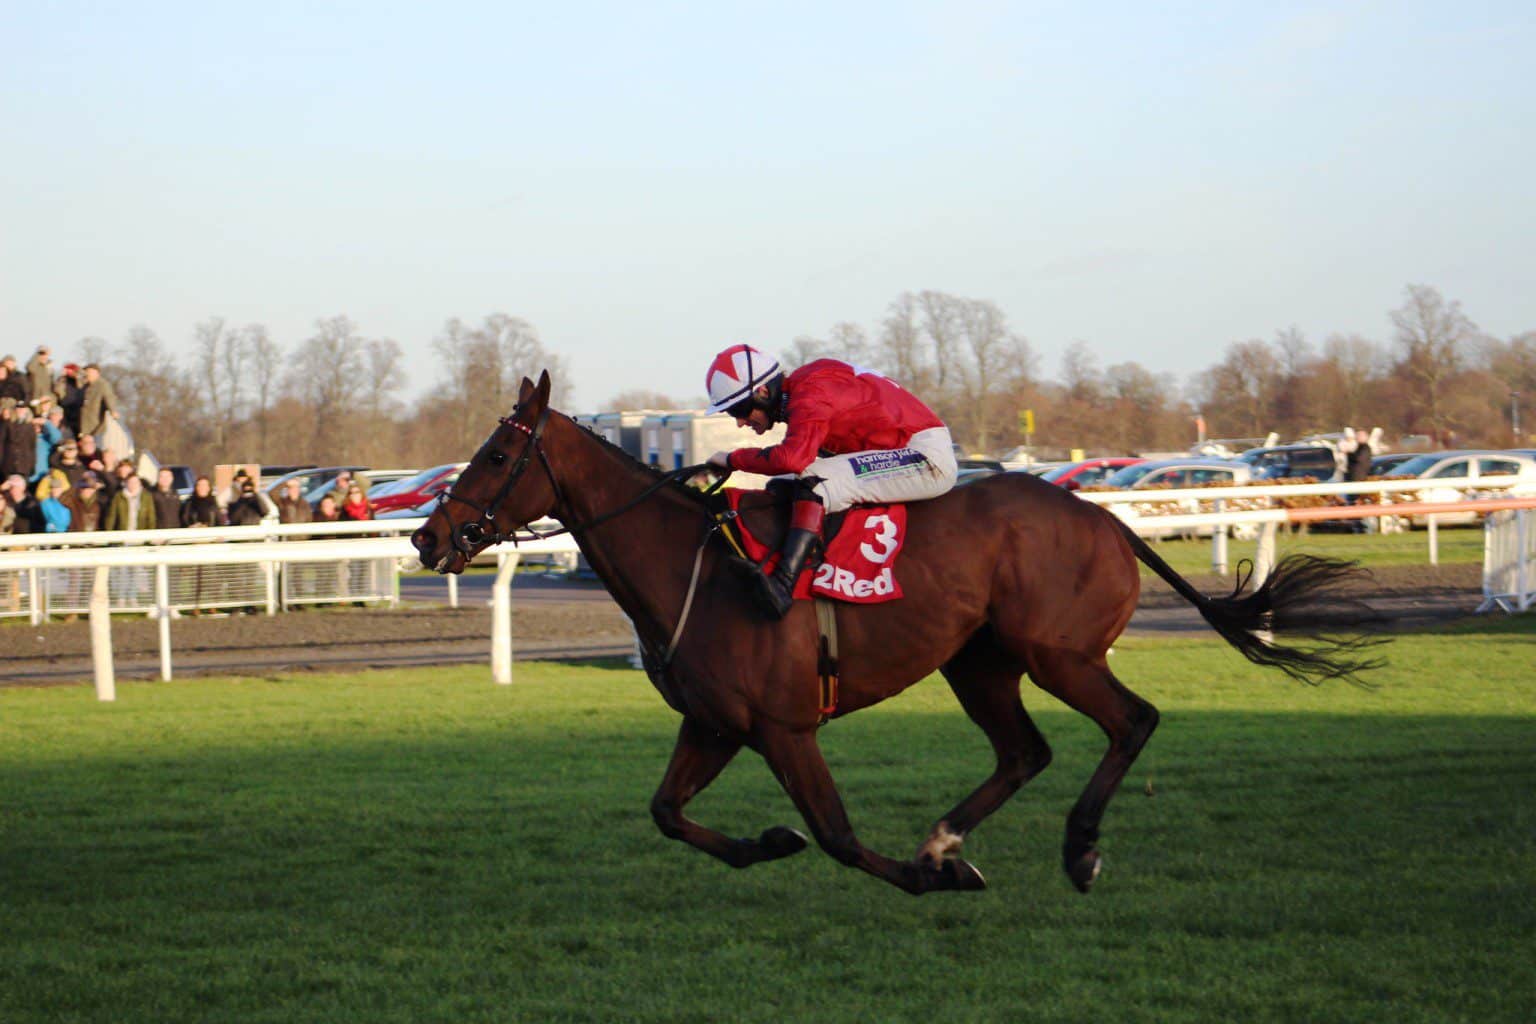
Featured Image: (CC BY 4.0) – IBoxingday 2016 Kempton Park Horse Race | michimaya | Flickr