
Switches in Class Revisited
The premise of this article is to investigate the widely accepted wisdom — something of a cliché since it’s routinely cited by analysts and commentators — that punters should pay particular attention to horses dropped in class, because, for example, a shrewd trainer may be giving their horse a better chance of winning in a lower-grade contest.
Time to put away any preconceptions and examine how the data bears this out.
We’re going to take a comprehensive look at switches in class — but also drill into different race types and switches between handicaps and non-handicaps.
Finally, we’ll focus in on flat handicaps, where this cliché seems to persist most strongly, and test whether switches using the granular rating data behind each handicap can offer deeper insight than class labels alone.
About the Dataset
All UK races since 2011 were analysed using Smartform’s historical racing database. Runners were included only if they had a last-time-out run also in the UK, and only where both races had defined class and race type values.
National Hunt Flat races were excluded due to their specialist nature — they often act as stepping stones for jump careers and offer limited scope for like-for-like comparison.
The analysis includes only runners with two or more career starts, thereby excluding debutants, and ensures the comparisons are contiguous: we require that both the current and previous runs are of the same race type and occur in back-to-back appearances.Another methodological decision concerns returns.
While it’s increasingly common to report Betfair Starting Price (BSP) profits, we opted for industry Starting Prices (SP).
Why?
Because strategies that even approach profitability at SP are rare — and deserve attention.
BSP results can flatter strategies that aren’t truly viable in practice, especially once commission and market inefficiencies are factored in.
Using SP as our baseline is deliberately conservative: if there’s signal here, it should still show up.
Laying Out the Landscape: Class and Race-Type Movement
Our first aim was to get a comprehensive overview of class movement across all race types — not only up and down in class, but also those staying at the same level — and within those movements, to differentiate between handicaps and non-handicaps.
This gave us a broad view of how horses switch between levels of competition and formats — and as it turns out, there are many permutations to explore.
Class Movement Table: Class Direction × Handicap Format × Race Type:
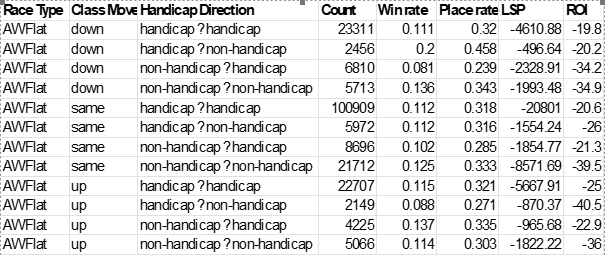
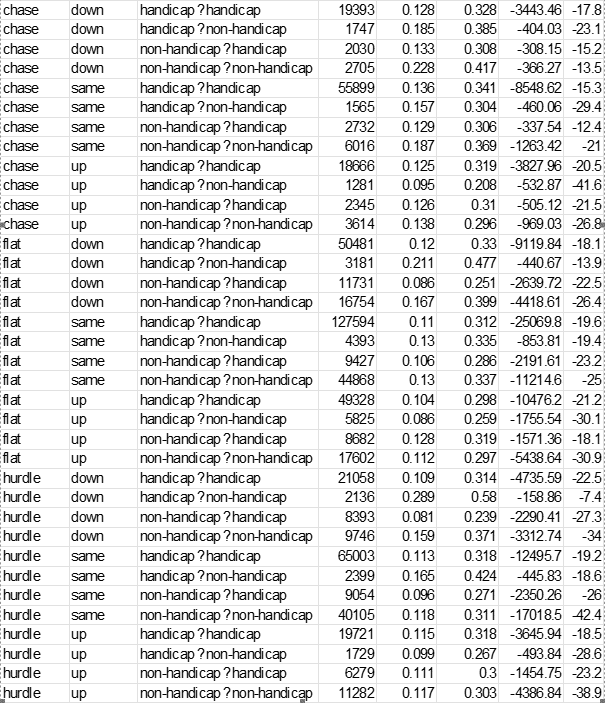
This summary alone can serve as a launchpad for further exploration. Interesting edges may lie outside the usual scope of flat handicaps — for example, runners dropping out of handicap hurdles into non-handicap company return notably high win rates, as do horses competing in all race types when moving down in class from a handicap to a stakes race.
But the heart of our investigation lies in the more widely discussed territory of flat handicaps, where movements in class are perhaps most keenly watched.
Drilling Into Flat Turf Handicaps: Class Versus Ratings
To dig deeper, we filtered down to UK flat turf handicaps only, from 2011 onwards, where reliable BHA race rating categories were present for both the current and last-time-out runs.
These race ratings are the official BHA-assigned ranges that determine a horse’s eligibility for particular handicap races. A horse rated 85 cannot enter a 0–75 contest. These ranges are not only functional but meaningful: they reflect the actual competitive level of each race. Arguably, you can compile even more meaningful ratings based on the official rating of the top rated horse competing in each race, since this gives you an effective rating band for the competitive level (e.g. If the top weighted horse is rated 73, we could argue the upper rating for the race is a 73 rather than a 75), but that is a subject for another article. For our purposes here, we will use the handicap race rating.
This means that, rather than looking at class alone, we can now assess movement in “class” (in the broadest sense) in addition to the numerical class structure, based on raw numerical race ratings — comparing whether a horse’s last-time-out handicap featured a higher, lower, or equivalent BHA race rating to its next run. For comparison purposes, we will also condense our flat class switching summary (strike rates for up in class, down in class, and same class between races) now we are looking at Flat Turf Handicaps only.
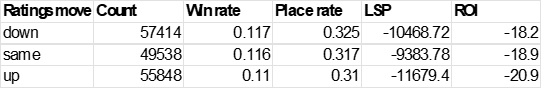
Rating Band Change Summary – Up, Same, Down Based on BHA Race Ratings:
Class Change Summary – Up, Same, Down Based on Official Class:
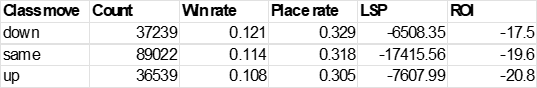
What stands out is that changes from last time out to the current race in terms of measuring class by the handicap race rating produce a smoother distribution of movement: nearly equal numbers of horses move up, down, or remain in equivalent ratings bands, approximately a third in each group.
This implies that horses regularly move between subtle gradations of competition quality that using class alone doesn’t capture (note that over half the sample show they continue to race in the same class as opposed to ratings band).
By the same token, the summary shows that whether horses are being placed in their next races by a whole class, or moving more gradually between ratings bands, a move down in class produces a higher strike rate across the board than remaining in the same class or ratings band or moving up.
Creating Tiers Within Class: A More Granular “Class” System
While raw rating changes are informative, we wanted to explore a tiered framework that more closely reflects how the BHA actually structures its handicaps in order to explore the more subtle movements in class in greater detail.
To do this, we assigned runners to tiers within a class, based on race rating ranges commonly seen in BHA conditions books and carrying through to the Smartform database. The bands were defined using the observed patterns in the data, aligning with familiar boundaries like 0–65, 0–75, 0–85 and so on.
These tiers are not arbitrary — they mirror official race structures as much as possible where we see that different classes fit different ratings ranges.
Below we’re classifying all races using a function that looks for the class and then the ratings band and moves on until the race and runners in that race find a home (or category).
Tier Definitions by Class:
# Class 6: 52–75
class == 6 & rating >= 65, “C6-Tier A”,
class == 6 & rating >= 60, “C6-Tier B”,
class == 6 & rating >= 52, “C6-Tier C”,
# Class 5: 65–80
class == 5 & rating >= 75, “C5-Tier A”,
class == 5 & rating >= 70, “C5-Tier B”,
class == 5 & rating >= 65, “C5-Tier C”,
# Class 4: 75–90
class == 4 & rating >= 85, “C4-Tier A”,
class == 4 & rating >= 80, “C4-Tier B”,
class == 4 & rating >= 75, “C4-Tier C”,
# Class 3: 75–97
class == 3 & rating >= 90, “C3-Tier A”,
class == 3 & rating >= 85, “C3-Tier B”,
class == 3 & rating >= 75, “C3-Tier C”,
# Class 2 and Class 1: 95–110+
class %in% c (1, 2) & rating >= 105, “C2-Tier A”,
class %in% c (1, 2) & rating >= 100, “C2-Tier B”,
class %in% c (1, 2) & rating >= 95, “C2-Tier C”,
Note thatwe find that the same ratings bands can exist in different classes, but where this Is the case in our classification system the race will be a lower tier in the higher class and a higher tier in the lower class.
Class and Ratings Tier Movement Results
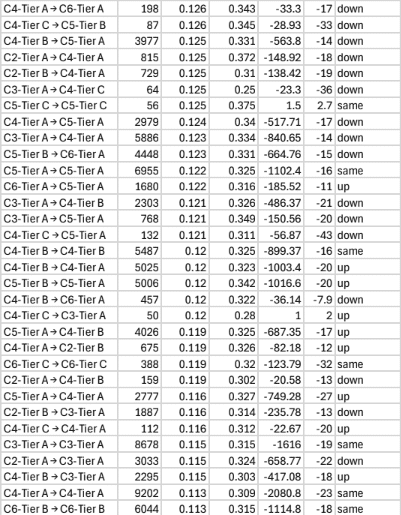
The following table presents the results of the granular classification system by summarising performance across all rating tier movements, grouping results by their previous and current tiers and evaluating performance in the current race following the switch. For context, we also labelled each row as “up,” “down,” or “same” based on whether the runner moved into tougher or easier company — for example, moving from C2-Tier A to C4-Tier C is clearly a drop in class, while C6-Tier C to C6-Tier A is still a step up.
Note that there are 171 movements in total! For the sake of space as well as statistical significance, we therefore filtered our dataset to include only movements with at least 50 runners, so that we can focus on those tier shifts with enough volume to draw meaningful insight.
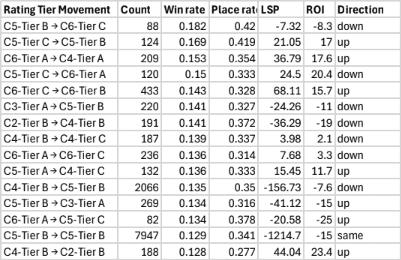
These results show a mixed picture, but some strong patterns still emerge — and so do a few unexpected reversals of trend.
Top Pockets of Positive Value
These movements show above-average strike rates, solid place rates, and crucially, positive ROI or low downside for significant sample sizes (e.g. ≥80):
1. C5-Tier C → C5-Tier B
• Count: 124
• Win Rate: 16.9%
• ROI: +17.0%
• Notes: This is a same-class upgrade within C5 — classic “improver” profile. Horses that were in the lowest bracket now step into mid-band and often retain form.
2. C6-Tier A → C4-Tier A
• Count: 209
• Win Rate: 15.3%
• ROI: +17.6%
• Notes: This is a big jump in class and tier, and yet they’re profitable. Likely these are well-prepped, rapidly improving horses underestimated in the market. Very counter-intuitive — might be prep-to-handicap horses or 3yo improvers.
3. C5-Tier C → C6-Tier A
• Count: 120
• Win Rate: 15.0%
• ROI: +20.4%
• Notes: Despite class drop, this is a double leap in tier quality. Suggests horses previously outclassed are now dropped into ideal conditions.
4. C4-Tier B → C2-Tier B
• Count: 188
• Win Rate: 12.8%
• ROI: +23.4%
• Notes: Another class leaper that lands in top company and wins — again pointing to rapid progression rather than seasoned handicapper form.
5. C5-Tier A → C5-Tier C
• Count: 66
• Win Rate: 10.6%
• ROI: +33.7%
• Notes: Looks like a drop within class but jump in tier — horses perhaps weighted out last time and now dropped.
Patterns Worth Watching
• C6 upward movements to better tiers (A or B) seem to contain a surprising amount of latent value — perhaps the market underrates Class 6 horses when they’re fit and well-handicapped.
• Same-class tier upgrades (like C5-C→B or C4-C→B) often outperform their counterparts moving down.
Conclusion
Across 150,000+ flat turf handicap runners, the narrative is consistent but not simplistic. While horses dropping in class do win more often, the margin is very slim — and not necessarily where the value lies.
When we examine movements in granular class/rating tiers, a more complex picture emerges. The real profit opportunities appear in specific, sometimes counterintuitive, combinations:
- Horses up in class but with improving profiles.
- Horses stepping into sharper rating tiers, even if nominally in the same class.
- Tier risers within class who retain form and are undervalued by the market.
Critically, many of the best ROI figures come not from blanket “class droppers” but from horses that fit a distinct progression pattern — those likely to be underestimated by traditional class heuristics but flagged by deeper ratings context.
The Takeaway?
If you’re relying on class drops alone to find more winners, you’re not wrong — but you might be missing the real edge. It’s not even whether a horse is up or down in class — it’s whether the movement reflects the horse’s true profile and potential.
For punters, this data underscores the importance of looking beyond the class label and understanding how a horse’s recent form, fitness, and conditions intersect with the structure of the handicap itself.
Colin Magee