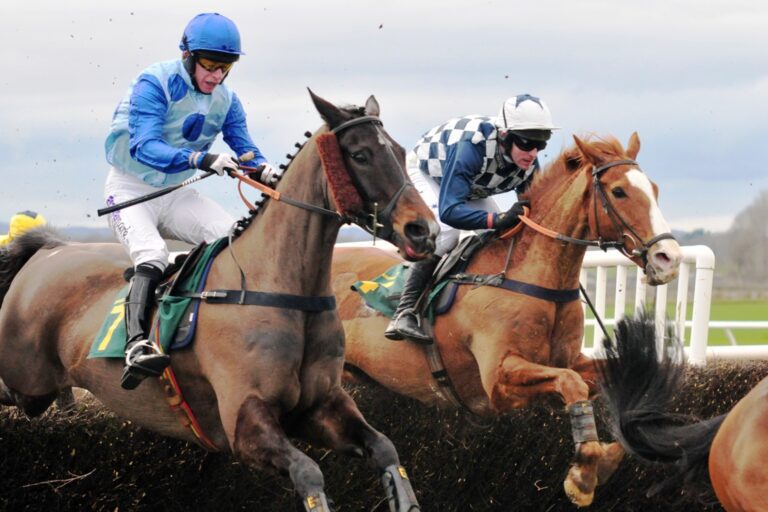
Summer Jumpers
Like most people, I wonder where the days go as I get older, and as I write we are heading towards the summer, assuming we have one of course.
This month I am thinking a little outside the box, not Royal Ascot or Glorious Goodwood as you may have expected, but the summer jumpers instead (my aim is to find a line that makes a profit wherever that may be).
As an oldie I yearn for the good old days when there was clear demarcation between Turf Flat and the National Hunt Jumps season, no summer jumping, and no all-weather over the winter, but apparently it is called progress, and we all need to live with it, and if I can find a money making line then suddenly, I am all in favour!
The Theory:
Once the likes of Dan Skelton, Nicky Henderson, Paul Nicholls and Co unleash their battalions, the smaller yards with their cheaper purchases are by definition up against it, and struggle to find the winners they need to pay the bills.
Those with horses at their best on a firmer surface find themselves with nowhere to run once the rains come, so I am looking for those trainers who make a profit for the months of June, July, August, and September (amalgamated), and I will then break those down by course and by distance (top trainers only) to see if we can increase the percentages of profit.
Data used – 1st June 2015 to 4th June 2025 only, Uk and Ireland only.
As always, we will start with an overall pass to see what figures we have to make comparisons to later
All National Hunt races on turf – top 5 most profitable to Betfair Starting Price (BSP order), minimum of 100 runners and 10 winners to qualify
| Trainer | Runners | Winners | Strike Rate | Profit/Loss to Betfair SP | Profit/Loss to Industry SP | Longest Winning Run (LWR) | Longest Losing Run (LLR) |
| Eoin Christopher McCarthy | 338 | 18 | 5.36% | +£1071.84 | +£198.75 | 1 | 60 |
| Neil Mulholland | 1130 | 169 | 14.96% | +£484.52 | +£25.84 | 3 | 68 |
| Ray Hackett | 193 | 18 | 9.33% | +£400.96 | +£43.25 | 2 | 38 |
| M F Morris | 250 | 23 | 9.20% | +£303.96 | +£4.63 | 2 | 41 |
| Peter Bowen | 947 | 186 | 19.64% | +£292.48 | -£12.25 | 3 | 55 |
| TOTALS | 2858 | 414 | 14.49% | +£2553.76 | +£260.22 | N/A | N/A |
Summary:
Firstly, this needs a cleverly managed betting bank to cope with some long losing runs and low strike rates. However, for those patient enough there are some acceptable if not overly spectacular profits to be made, with a Return On Investment of 89.35%.
Now we need to have a look by code, chases, hurdles, and bumpers (National Hunt Flat races), in that order.
Chases only (40 or more runners, 5 or more winners as the sample is by definition now smaller).
| Trainer | Runners | Winners | Strike Rate | Profit/Loss to Betfair SP | Profit/Loss to Industry SP | Longest Winning Run (LWR) | Longest Losing Run (LLR) |
| M F Morris | 123 | 15 | 12.20% | +£368.94 | +£82.38 | 2 | 14 |
| Henry De Bromhead | 769 | 143 | 18.60% | +£235.22 | +£33.59 | 6 | 33 |
| Norman Lee | 45 | 6 | 13.33% | +£228.83 | +£24.18 | 4 | 26 |
| Gordon Elliott | 882 | 132 | 14.97% | +£114.57 | -£141.31 | 3 | 42 |
| Thomas Gibney | 55 | 7 | 12.73% | +£102.71 | +£45.63 | 1 | 15 |
| TOTALS | 1874 | 303 | 16.17% | +£1050.27 | +£44.47 | N/A | N/A |
Summary:
Who knew I would be writing about Irish trainers exclusively?
Facts are facts and they are what they are, but with a Return On Investment of 56% its ok, but not as good as hoped and we may do better over hurdles?
Hurdles only (40 or more runners, 5 or more winners as the sample is by definition now smaller).
| Trainer | Runners | Winners | Strike Rate | Profit/Loss to Betfair SP | Profit/Loss to Industry SP | Longest Winning Run (LWR) | Longest Losing Run (LLR) |
| Eoin Christopher McCarthy | 266 | 16 | 6.02% | +£1111.44 | +£244.00 | 1 | 49 |
| Neil Mulholland | 742 | 116 | 15.63% | +£517.22 | +£107.02 | 3 | 46 |
| Kieran Purcell | 104 | 6 | 5.77% | +£472.91 | +£95.00 | 1 | 30 |
| Peter Bowen | 384 | 66 | 17.19% | +£247.92 | +£3.13 | 4 | 31 |
| Mark Michael McNiff | 366 | 41 | 11.20% | +£221.33 | -£4.67 | 2 | 42 |
| TOTALS | 1862 | 245 | 13.16% | +£2570.52 | +£444.48 | N/A | N/A |
Summary:
I am still not overly impressed with either the strike rates or the long losing runs, but a Return On Investment of 138.05% is very good when you think we are only betting for four months of the year and is something to consider seriously for future actions.
Bumpers only (10 or more runners, 4 or more winners as the sample is by definition now even smaller).
| Trainer | Runners | Winners | Strike Rate | Profit/Loss to Betfair SP | Profit/Loss to Industry SP | Longest Winning Run (LWR) | Longest Losing Run (LLR) |
| Matthew J Smith | 43 | 4 | 9.30% | +£189.50 | +£72.50 | 1 | 15 |
| John C McConnell | 93 | 23 | 24.73% | +£108.90 | +£47.20 | 3 | 11 |
| Gordon Elliott | 346 | 66 | 19.08% | +£72.68 | -£38.34 | 3 | 23 |
| Robert Stephens | 23 | 4 | 17.39% | +£59.69 | +£31.00 | 2 | 9 |
| David Harry Kelly | 33 | 6 | 18.18% | +£57.73 | +£29.50 | 2 | 8 |
| TOTALS | 538 | 103 | 19.15% | +£488.50 | +£141.86 | N/A | N/A |
Summary:
I was particularly taken with the figures for John C McConnell here with a Return On Investment of over 117% and a strike rate of close to one in four. The overall strike rate is the best so far, and with very few bets in comparison, this may be the most suitable option for some of you.
Next up, I am moving on with the number one (most profitable) trainer from each list by code to see if we can drill down further to boost the figures.
Chases
M F Morris
By course (top 3 only)
| Course | Runners | Winners | Strike Rate | Profit/Loss to Betfair SP | Profit/Loss to Industry SP | Longest Winning Run (LWR) | Longest Losing Run (LLR) |
| Galway | 19 | 2 | 10.53% | +£322.21 | +£65.00 | 1 | 12 |
| Wexford | 13 | 3 | 23.08% | +£39.90 | +£26.50 | 1 | 5 |
| Listowel | 16 | 3 | 18.75% | +£10.31 | +£5.63 | 1 | 7 |
| TOTALS | 48 | 8 | 16.67% | +£372.42 | +£97.13 | N/A | N/A |
Summary:
A small sample possibly not to be relied on but some good profits regardless.
Top by distance (top 3 only)
| Distance (in furlongs) | Runners | Winners | Strike Rate | Profit/Loss to Betfair SP | Profit/Loss to Industry SP | Longest Winning Run (LWR) | Longest Losing Run (LLR) |
| 22 | 33 | 2 | 6.06% | +£308.21 | +£154.55 | 1 | 16 |
| 20 | 20 | 5 | 25.00% | +£54.61 | +£33.25 | 2 | 7 |
| 25 | 16 | 3 | 18.75% | +£18.15 | +£14.50 | 2 | 13 |
| TOTALS | 69 | 10 | 14.49& | +£380.97 | +£202.30 | N/A | N/A |
Summary:
Superb returns but again, whether the sample is big enough to take at face value I will leave up to you.
Hurdles
Eoin Christopher McCarthy
| Course | Runners | Winners | Strike Rate | Profit/Loss to Betfair SP | Profit/Loss to Industry SP | Longest Winning Run (LWR) | Longest Losing Run (LLR) |
| Listowel | 99 | 4 | 4.04% | +£1121.65 | +£294.50 | 1 | 46 |
| Killarney | 26 | 4 | 14.38% | +£25.65 | +£12.00 | 1 | 12 |
| Cork | 17 | 2 | 11.76% | +£18.58 | +£9.00 | 1 | 7 |
| TOTALS | 142 | 10 | 7.04% | +£1165.88 | +£315.50 | N/A | N/A |
Summary:
Personally, it looks like we have one massively priced winner here that has skewed the figures, but that does not mean that won’t be repeated!
| Distance (in furlongs) | Runners | Winners | Strike Rate | Profit/Loss to Betfair SP | Profit/Loss to Industry SP | Longest Winning Run (LWR) | Longest Losing Run (LLR) |
| 16 | 85 | 4 | 4.71% | +£1127.60 | +£301.50 | 1 | 37 |
| 21 | 11 | 2 | 18.18% | +£16.33 | +£8.50 | 1 | 5 |
| 15 | 7 | 1 | 14.29% | +£12.62 | +£6.00 | 1 | 5 |
| TOTALS | 103 | 7 | 6.8% | +£1156.55 | +£316.00 | N/A | N/A |
Summary:
Similar to by track, huge profits suggest one or more big priced winners.,
Bumpers
Matthew J Smith
| Course | Runners | Winners | Strike Rate | Profit/Loss to Betfair SP | Profit/Loss to Industry SP | Longest Winning Run (LWR) | Longest Losing Run (LLR) |
| Downpatrick | 4 | 1 | 25.00% | +£98.11 | +£37.00 | 1 | 3 |
| Kilbeggan | 5 | 2 | 40.00% | +£66.57 | +£35.50 | 1 | 2 |
| Cork | 1 | 1 | 100.00% | +£57.82 | +£33.00 | 1 | 0 |
| TOTALS | 10 | 4 | 40.00% | +£222.50 | +£105.50 | N/A | N/A |
Summary:
I am taken with the Kilbeggan figures here despite the tiny sample size – interesting and something to consider…
| Distance (in furlongs) | Runners | Winners | Strike Rate | Profit/Loss to Betfair SP | Profit/Loss to Industry SP | Longest Winning Run (LWR) | Longest Losing Run (LLR) |
| 18 | 8 | 2 | 25.00% | +£152.93 | +£67.00 | 1 | 5 |
| 16 | 26 | 1 | 3.85% | +£37.72 | +£8.00 | 1 | 13 |
| 19 | 1 | 1 | 100.00% | +£6.86 | +£5.50 | 1 | 0 |
| TOTALS | 35 | 4 | 11.43% | +£197.51 | +£80.50 | N/A | N/A |
Summary:
Again please, please beware of the sample size, but there is still plenty there to think about.
Conclusion
There are an awful lot of numbers there for you to look at and use as you see fit.
The last set of tables obviously show the best percentages and profits, but they are from very small numbers and need to be treated cautiously, though you may spot a pattern (for example, the Matthew J Smith bumper horses do better over further than two miles (16 furlongs).
This concept will suit the more patient punters (long losing runs unfortunately), but the Returns On Investment look worth it is you manage your betting bank carefully and reap the dividends when you do have a big-priced success.
Sean Trivass is well-known freelance journalist who specialises in horse racing. His books can be found on Amazon here https://tinyurl.com/59t4dr7e while his weekly blog is updated Friday evening on his website at www.writesports.net. Any ideas for future articles – contact Sean via his website and he will investigate further!