
Micro Systems for July
Another month is upon us (already!) and it’s time to see what micro systems we can uncover to live test for July.
First though a look back at the systems we live tested for May.
The usual mixture, which, while a little disappointing in terms of systems going forward did produce a couple of nice ones and another that I will personally carry forward along with three that had no qualifiers at all that can be looked at again next May.
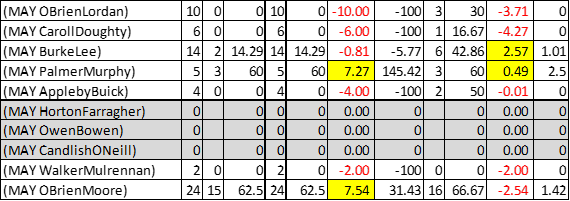
The O’Brien Lordan system was a complete washout with no winners from ten qualifiers. They did place three times but not enough to find any profit. Carroll Doughty was similar with none from six and just the one place. Meanwhile Appleby and Buick only teamed up four times within our filters failing to land a winner. They did place in two of the four but essentially broke even on those with a -0.01 point return.
Whilst O’Brien and Lordan failed to find winners on our system his partnership with Ryan Moore did. I don’t think that was ever in doubt though. What was in doubt is whether what are undoubtedly generally an over bet pairing could return any profit. The answer was yes. They managed 15 winners from their 25 qualifiers for an incredible strike rate of 62.5%, returning 7.54 points of profit for an ROI of 31.43%.
The other major success was the Palmer Murphy combo who despite just five qualifiers across the month, won three of them for 7.27 points profit at an ROI of 145.42%. Also bringing in a half point place profit from those three as well.
That last one is one I will carry forward to next May. It’s the Burke and Lee partnership.
They had just the two wins from 14, although only lost 0.81 points and at the same time brought home 6 places (42.86%) for a 2.57 points profit, meaning over both they came in 1.61 points ahead and as such, worth running again next May, I think.
Here’s the complete table for May.
Some regular trainer/ jockey systems for this month along with something just a little bit different as well in our quest to find some monthly systems to test. I’m going to do the new one first and then I’ll move on to our usual combo systems.
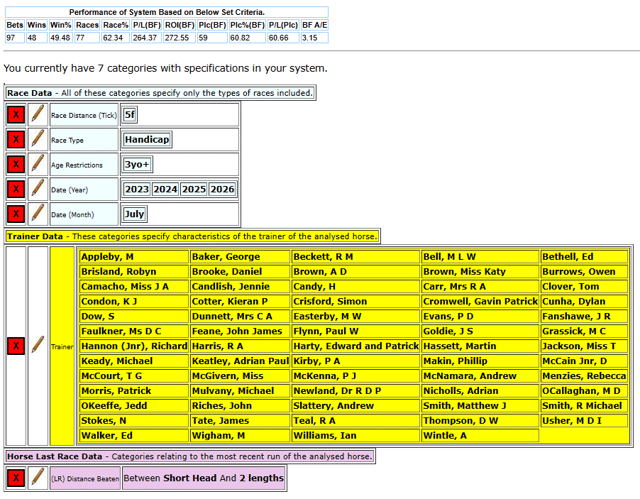
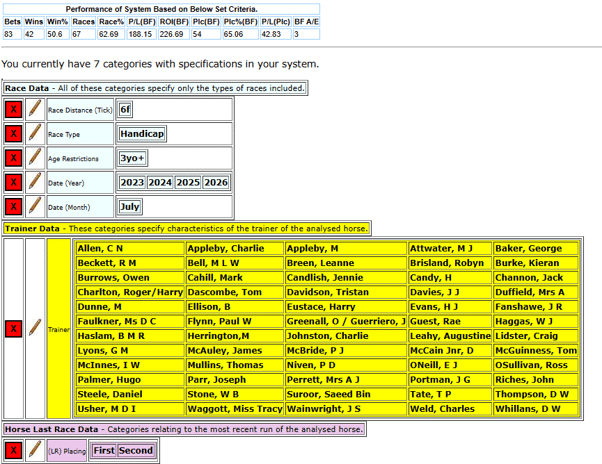
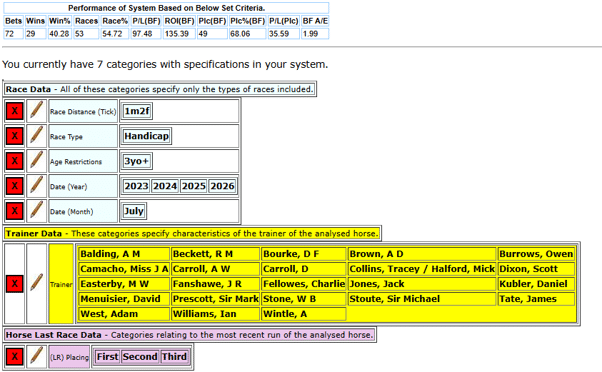
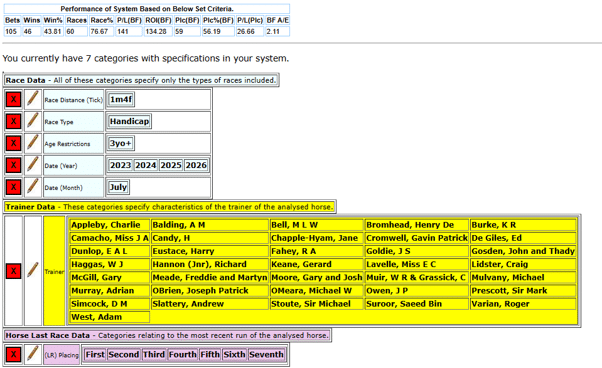
I’m going to take a look at 3yo+ Handicaps from past July’s, and we’ll break them down by distance. We’ll use the best performing trainers from our data which will be the last three July’s, 2023, 2024 and 2025.
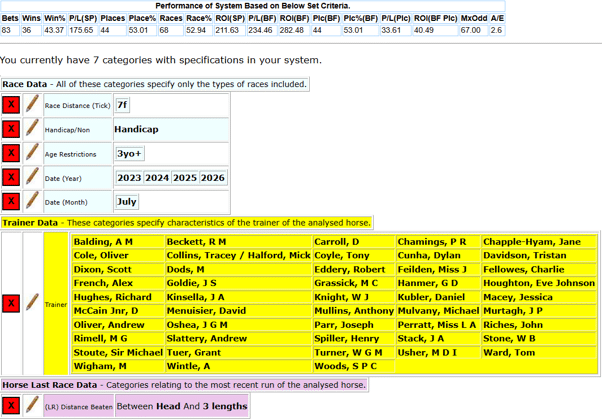
First off then are 3yo+ Handicaps over 5 furlongs.
Our next filter will be to select trainers. I’m going to start by selecting all those with a strike rate of 20% or higher.
This gives us an initial pretty hefty bet total in terms of a micro system, but this is our starting point. Race wise the three years have around 50 races bet on but around 130 qualifiers suggesting 2-3 qualifiers per race on average.
Let’s dig in a little further from this filtered data to see if we can perhaps find a couple of micro(ish) systems within the subset of data.
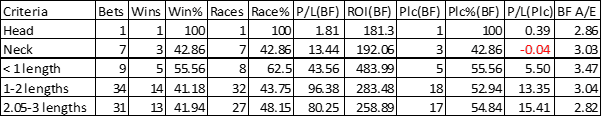
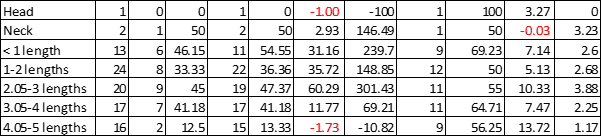
The distance beaten last time out makes for interesting reading and throws up what would appear to be a potentially very good system for the month. Perhaps a few too many qualifiers to really be considered a micro system in terms of numbers but on average it should throw up on average around a bet per day.
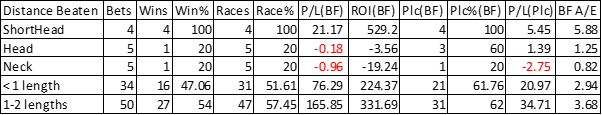
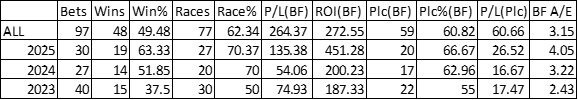
All those beaten last time out by between a short head and two lengths have managed to win 49% of the time next time out in this dataset.
The nature of these sorts of ones with a selection of multiple trainers, means that it is best to paper test or use very small stakes to test live. The fact that we are to an extent cherry pick trainers who have done well, albeit with 3 years of data to back it up, means that sometimes, and I’ve seen it happen from past experience, things do not go anywhere near as well as expected. Other times they do but that’s why they need to be tested live first.
Bear in mind with these losing runs there may be multiple runners in a race.
Longest Losing Run (Wins): 5
Longest Losing Run (Places): 3
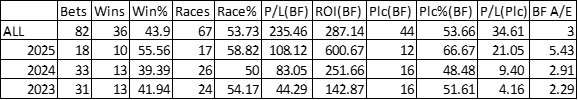
A look at the same race criteria but now concentrating on 6 furlong races
We’ll start as before with our trainers who have at least a 20% strike rate in our data.
If we look at those who finished in the first two last time out, then we get the following impressive table.
Again, around one bet per day and the same caveat applies as before, paper or small stakes live test.
Longest Losing Run (Wins): 5
Longest Losing Run (Places): 4
Onwards now to look at 7 furlongs.
The distance beaten table from all the trainers who have a strike rate of 20% or higher gives us a similar range to our 5 furlong system.
This leaves us again with very impressive data as you would expect. We will see how it pans out on the live test.
Longest Losing Run (Wins): 5
Longest Losing Run (Places): 5
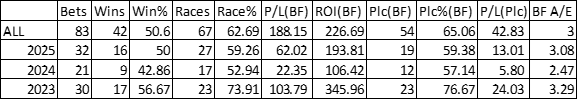
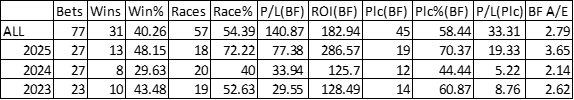
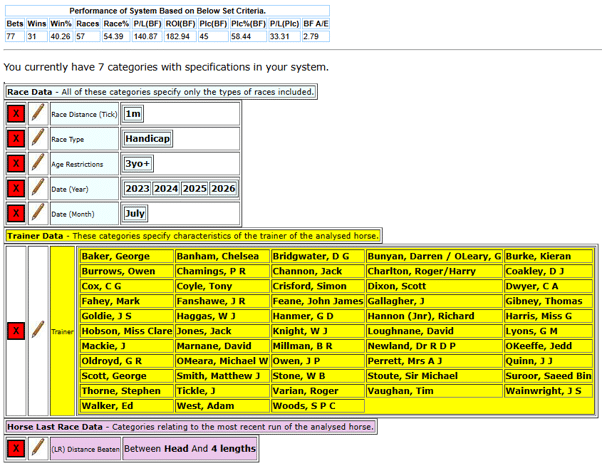
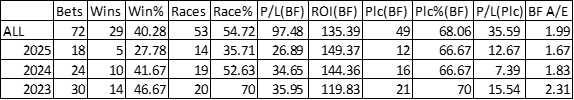
Look now at a race distance of 1 mile there’s another opportunity with the distance beaten in last race. Those finishing anywhere within 5 lengths of the winner last time out produce the following table.
By year looks like this.
Longest Losing Run (Wins): 5
Longest Losing Run (Places): 4
1 mile 2 furlong races now and taking our 20%+ strike rate trainers, we get this table when we look at those who finished in the first three last time out.
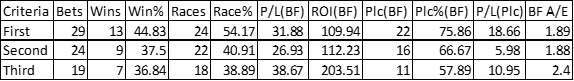
This gives us the table below when looked at by year.
Longest Losing Run (Wins): 6
Longest Losing Run (Places): 3
Finally, for these 3yo+’s we’ll look at 1 mile 4 furlongs.
Same criteria again on trainers with the 20% minimum strike rate cut off. Due to the smaller number of races, we can actually take all those horses that finished in the top seven last time out. It will leave us with over 30 bets from each year but not by too many.
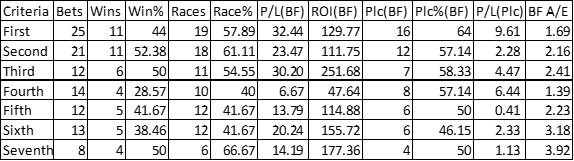
Our table by year looks like this.
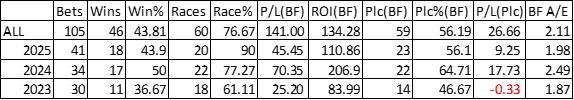
Longest Losing Run (Wins): 5
Longest Losing Run (Places): 5
I’m intrigued to see how these go during the coming July.
|
The rest of this article is for Platinum members. You've just seen what our experts do with publicly available data — the Platinum section is where the specific angles, numbers and actionable conclusions live. Platinum members also get daily system selections in their inbox by 2am, tips from top tipsters, Win Big Golf selections, and access to 11 years of magazine archives. |