Percentage of Horses Beaten Revisited
A couple of months ago in an article for On Course Profits, I looked briefly at a different ‘measure’ of last time out performance; namely ‘percentage of horses beaten’. I have become more interested in this idea in recent months and I have lots of ideas I want to test. As before I will call this %HB for short.
Some of this data can be found on two excellent websites namely Geegeez and Horseracebase. They both have slightly different abbreviations for it, but clearly, they too think it is a worthwhile metric to use.
Just to recap what I mean by %HB let me give you an example. If a horse finishes 6th in an 11 runner race, then of its 10 rivals the horse has beaten 5. Hence, we divide 5 by 10 to give us 50% or 0.50. I am going to use the decimal figure in this article for %HB.
The higher the figure the more runners that horse has beaten.
A Simple Experiment – is 12 month horse form relevant?
Using %HB as my form metric I wanted to examine whether the form of a horse over 12 months was relevant when it came to subsequent runs thereafter.
For this type of idea, the time frame chosen can be any year or years.
I decided to avoid 2020 data as the Covid pandemic had a big impact on horse racing in that year with lots of meetings cancelled, as well as affecting the training of the horses.
Hence, I went back to 2018 and collated all National Hunt Racing results in the UK from that year. From there, for each individual horse I calculated, or should I say Microsoft Excel calculated, their %HB figure for 2018 as a whole.
I then ignored any horse that had raced 5 times or less as I only wanted horses with a decent number of runs to hopefully give me more accurate %HB figures. This still gave me a huge sample size as a total of 1992 horses had run 6 or more times in that year.
From this group of horses, I noted the horses with the highest %HB figures for 2018 and those with the lowest %HB figures. I decided to compare 50 horses in total: 25 from each group by looking at their performance / record in the following year (2019).
Clearly, I was hoping that the horses with the highest %HB figures from 2018 would outperform the horses with the lowest ones when it came to 2019 as well.
Firstly, I am going to take a look at the 2019 race records of the 25 horses with the highest %HB figures from 2018:
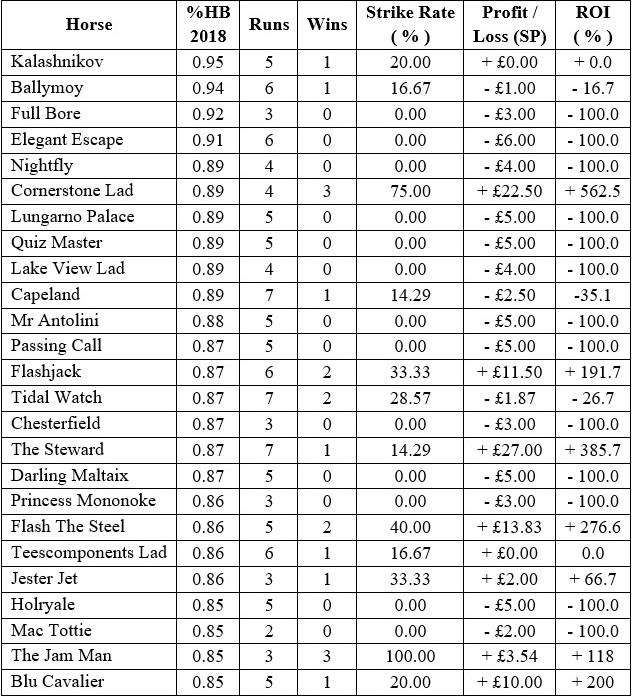
7 horses made a profit over the whole year, 2 broke even, and the remaining 16 made a loss. However, when you combine all 25 horses, they actually made an overall profit to Industry Starting Price – between them there were 19 wins from 120 runs (SR 15.8%) for a profit of £29.00 (ROI +24.2%).
I used normal SP rather than Betfair SP to avoid any big priced Betfair winners skewing the results. This made sense to me as the sample sizes I am using are relatively modest.
In our Gold edition Dave looks at those horses that had the lowest %HB figures in 2018 and their subsequent performance in 2019, and in particular takes a look at the National Hunt stats.
To read the rest of this article upgrade to a Gold or Platinum account now by clicking HERE
Already a Gold or Platinum member? Read the full article in Issue 96
David Renham
Featured Image: (CC BY 4.0) – Win, Place, Show | Horse racing at Arlington Park. | Paul Kehrer | Flickr